Sellersphere, an all-encompassing online platform, fuels social sellers by offering a unified hub to handle social networking accounts, evaluate efficiency, and fine-tune content approaches.
My role
UX Designer
Duration
5 weeks
The Rise of Social Sellers
A social seller is an individual or business that uses social media platforms to sell products or services. They leverage the power of social media to connect with potential customers, build relationships, and ultimately drive sales.
Social media platforms are no longer just for personal connections; they've become powerful tools for social selling. This strategic approach allows salespeople to leverage social networks to:
Connect and build relationships with prospects
Increase brand awareness
Generate leads and boost sales

Problem Statement
Social sellers are drowning in a sea of platforms, data, and disconnected tools.
Fragmented landscape
Managing multiple social media accounts with their unique features is time-consuming and inefficient.
Data Deluge
Extracting meaningful insights from the vast amount of social media data is overwhelming.
Limited Visibility
Lack of competitor analysis hinders growth opportunities.
Disconnected Teams
Disjointed tools across platforms create communication and collaboration hurdles within sales teams
Solution
Design an All-in-One Social Selling Command Center
Design a user-friendly web app that centralizes social media management across major platforms, transforms data into actionable insights, streamlines content scheduling, and fosters collaboration within sales teams, empowering social sellers to focus on building relationships and driving sales.
Design Process
Understanding the problem
Analyze existing social media management platforms
Understanding the User
interviews and online research
Identifying user pain points
Ideate
Identifying different use cases
Prioritize features based on user research and product goals
Design
Low-fidelity Wireframe
Visual design system
High-fidelity Prototype, Creating screens and graphical representations to convey the ideas
Understanding
Understanding the User
Main Agenda of User Research is to understand the needs, challenges, and behaviors of social sellers in order to design a user-centric social media management platform.
User interview
Qualitative insights from a small-scale user interview
Secondary Research
Discussions, trends, and user pain points from Reddit and Quora
Competitive analysis
Analyze their strengths, weaknesses, and unique features
While it wasn't possible to chat with a ton of social sellers, we combined insights from online communities and a few direct interviews to build a clear picture of their needs.
Direct conversations with social sellers provided invaluable insights into their challenges and expectations. This understanding shaped SellerSphere's design, ensuring it aligned closely with user needs.
How Data is Used by Social Sellers
Know Your Audience: Understand customer demographics, interests, and behaviors to tailor content and messaging effectively.
Measure Performance: Track engagement metrics (likes, shares, comments, clicks) to evaluate content success.
02
01
Drive Conversions: Identify and nurture potential customers through social interactions to generate leads and sales.
Stay Ahead: Monitor competitor activity and industry trends to identify opportunities and optimize strategies.
04
03
Competitors

Hootsuite
Observations & Key Features
Key Features
Automation
Integrated social listening
marketing tools.
Team Collaboration
Analytics and Reporting
Layout
-Single dashboard view with customizable widgets for specific data points.
-Calendar view for managing content scheduling.
-Dedicated sections for influencer marketing and social commerce.
Visual Design
-Modern and user-friendly design.
-Vibrant color scheme and engaging visuals.
-Consistent branding with the Hootsuite brand identity.
UX Design
-Intuitive user interface with drag-and-drop functionality for customizing dashboards.
-Easy-to-use search and filter options for finding specific data.
-Comprehensive onboarding process for new users.

Later
Observations & Key Features
Key Features
Instagram-First Focus
social media scheduling
social analytics reports
data viz and customization
Storytelling Tools
Layout
-Divided into three main sections: content creation, scheduling, and analytics.
-Visual content creation tools are prominently displayed.
-Social media scheduling calendar provides a visual overview of planned posts.
Visual Design
-Minimalistic and aesthetically pleasing design.
-Focus on high-quality visuals and engaging content.
-Branding is consistent with the Later brand identity.
UX Design
-Highly intuitive interface.
-Drag-and-drop functionality for creating and scheduling content.
-Clear and concise social media analytics reports.
Insights from research
Time Management and Efficiency:
Social sellers struggle to balance managing multiple platforms, analyzing data, and creating engaging content within limited timeframes.
Data-Driven Insights:
Users seek actionable insights from social media data to inform their strategies and optimize performance.
Collaboration and Workflow:
Effective communication and collaboration among team members is crucial for successful social selling campaigns.
Ideate

High level use cases
‘ I want to manage all my social media accounts in one place. Juggling multiple platforms is a headache. I need a central hub to streamline my workflow.’
‘I want to make sense of all the data. Social media gives me tons of information, but I need insights that actually help me sell.’
‘I want to create content that connects. Scheduling posts, analyzing what works, and making sure my audience loves it is key to success.’
Micro level use cases
‘ I want to quickly schedule a post on Instagram and have it automatically cross-posted to Facebook.’
‘I need to see how my latest campaign performed and compare it to previous ones.’
‘I want to collaborate with my team on creating a new social media campaign.’
‘I want to measure the ROI of my social media efforts and see which platforms are driving the most sales.’

Social seller managements
Dashboard
Greetings
Search
Notifications
Total sale
Average order value
Sales growth
Sales Summary
Engagement
Likes
Comments
Shares
Followers
All media
Engagement summary
Conversion rates
Filter:
Weekly
Monthly
Yearly
All time
Items chart data
Filter:
today
yesterday
last 7 days
monthly
annually
Top performing
Items
item image
item name
sold quantity
Composer
Create new post
Calendar planner
New post
media
title
description
files
status
Complete
Advance options
Post
Content library
images
Gifs
templates
Trend
Import
Create new post
calendar view (show week, month, Year)
posts
title
image
platform
filter list
name
platform
period
upcoming
Move and Post
Planner
Sales Analytics
Sales data chart
Filter:
week
monthly
annually
platform
category
Inventory management:
Order fulfilment tracking
description
date
amount
status
Product reviews and ratings:
Customer feedback analysis
positive
negative
nuetral
words analysis
Associated words
Responses
Sales
Items chart data
Filter:
today
yesterday
last 7 days
monthly
annually
Best Sellers
Items
item image
item name
sold quantity
Media Analytics
Platforms selection
Sales data and trends
conversion rate
sales to ctr
filter
monthly
weekly
yearly
Engagement metrics
likes
comments
shares
reach
Top performing posts and ads
list view - post / ads
filter
monthly
weekly
yearly
Click-through rate (CTR)
By Platform:
Reach
Daily
Weekly
Monthly
Custom date range
By time
Campaign overview
goals
Budget
timeline
Return on investment (ROI)
By Campaign
Customer Insights
Demographics
Age
Gender
Location
Interests
Social media behavior
Likes, comments, shares
Click-through rate (CTR)
Purchase history
Customer lifetime value
Track individual and overall CLTV
Identify high-value customers
Develop targeted marketing campaigns
Content Management
Social listening
Track brand mentions and conversations
Identify trends and opportunities
Respond to customer inquiries and complaints
Response
Collaborations
Communicate and collaborate with influencers:
Send direct messages
Share content and feedback
Track influencer performance
Settings
Account settings:
Manage account information
Update billing information
Set security preferences
Data integrations:
Connect the dashboard with social media accounts
Integrate with the e-commerce platform
Connect to other marketing and analytics tools
Notifications:
Set up email and mobile notifications for important updates
Customize notification preferences
Help and Support:
Knowledge base:
Search for answers to frequently asked questions
Access tutorials and guides
Community forum:
Connect with other social sellers
Share tips and best practices
Live chat support:
Get help from a support representative
Log-out
Information architecture
Features are grouped based on common tasks and workflows, reducing cognitive load and improving user experience. Essential features like Dashboard, Composer, and Analytics are prominently displayed for quick access. The structure allows for future expansion and integration of new features without compromising the overall design.
Overview
New post
Social listening
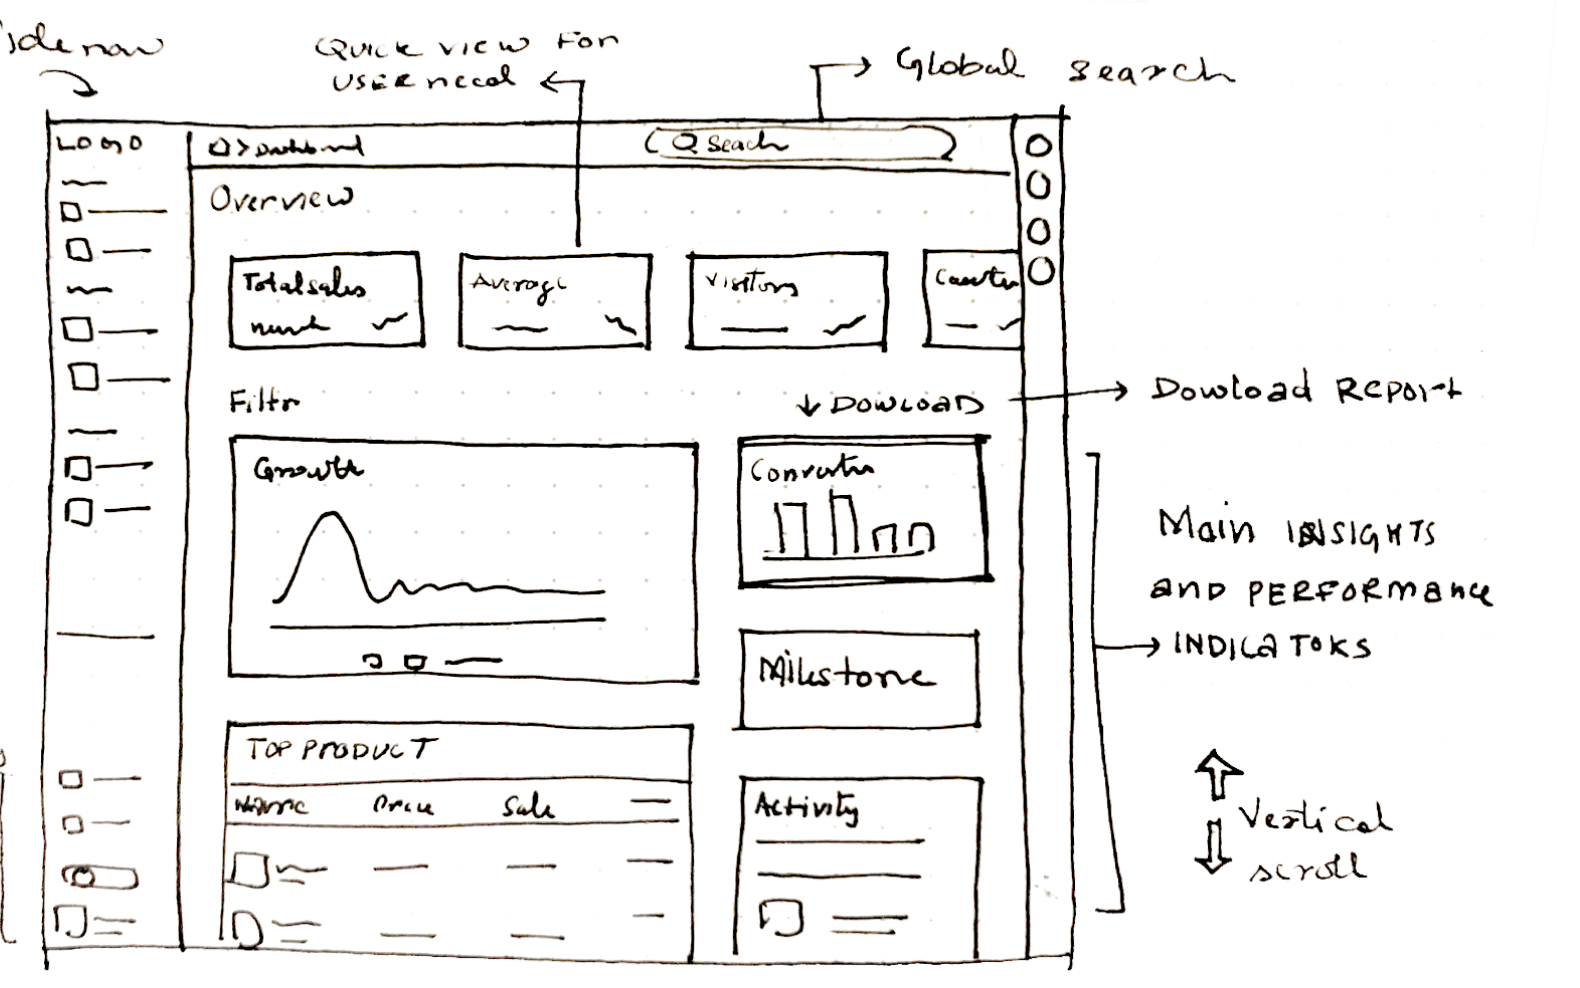
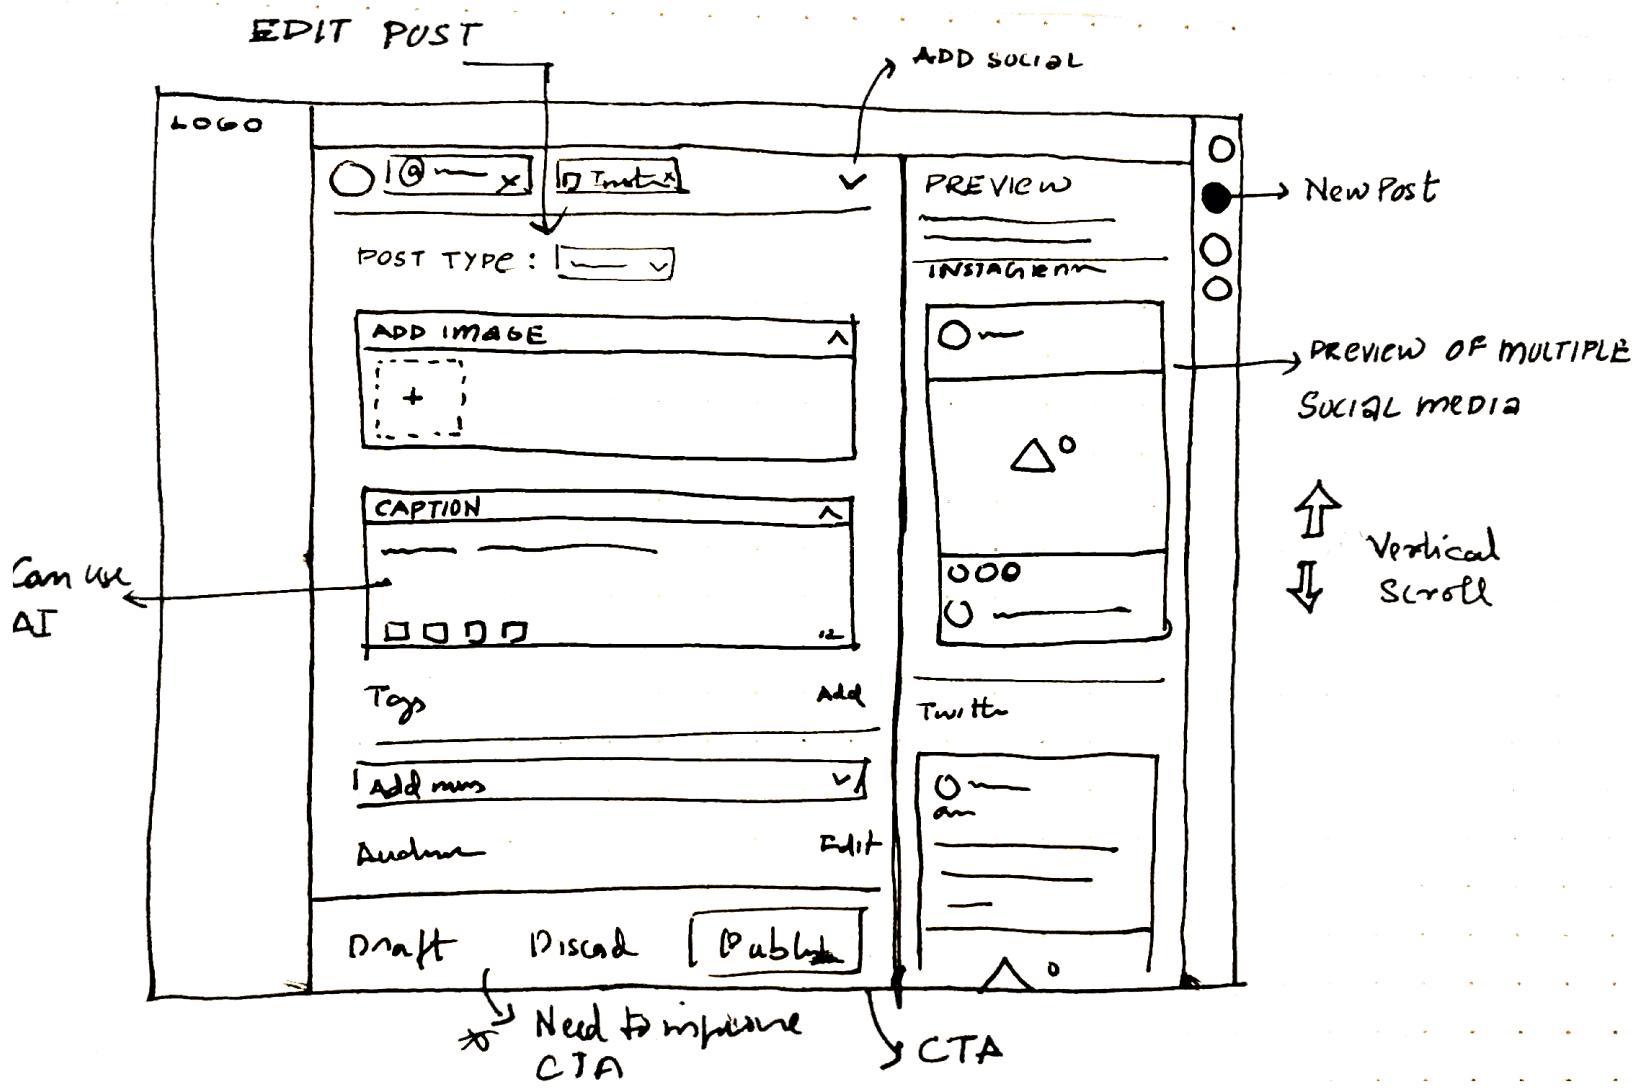
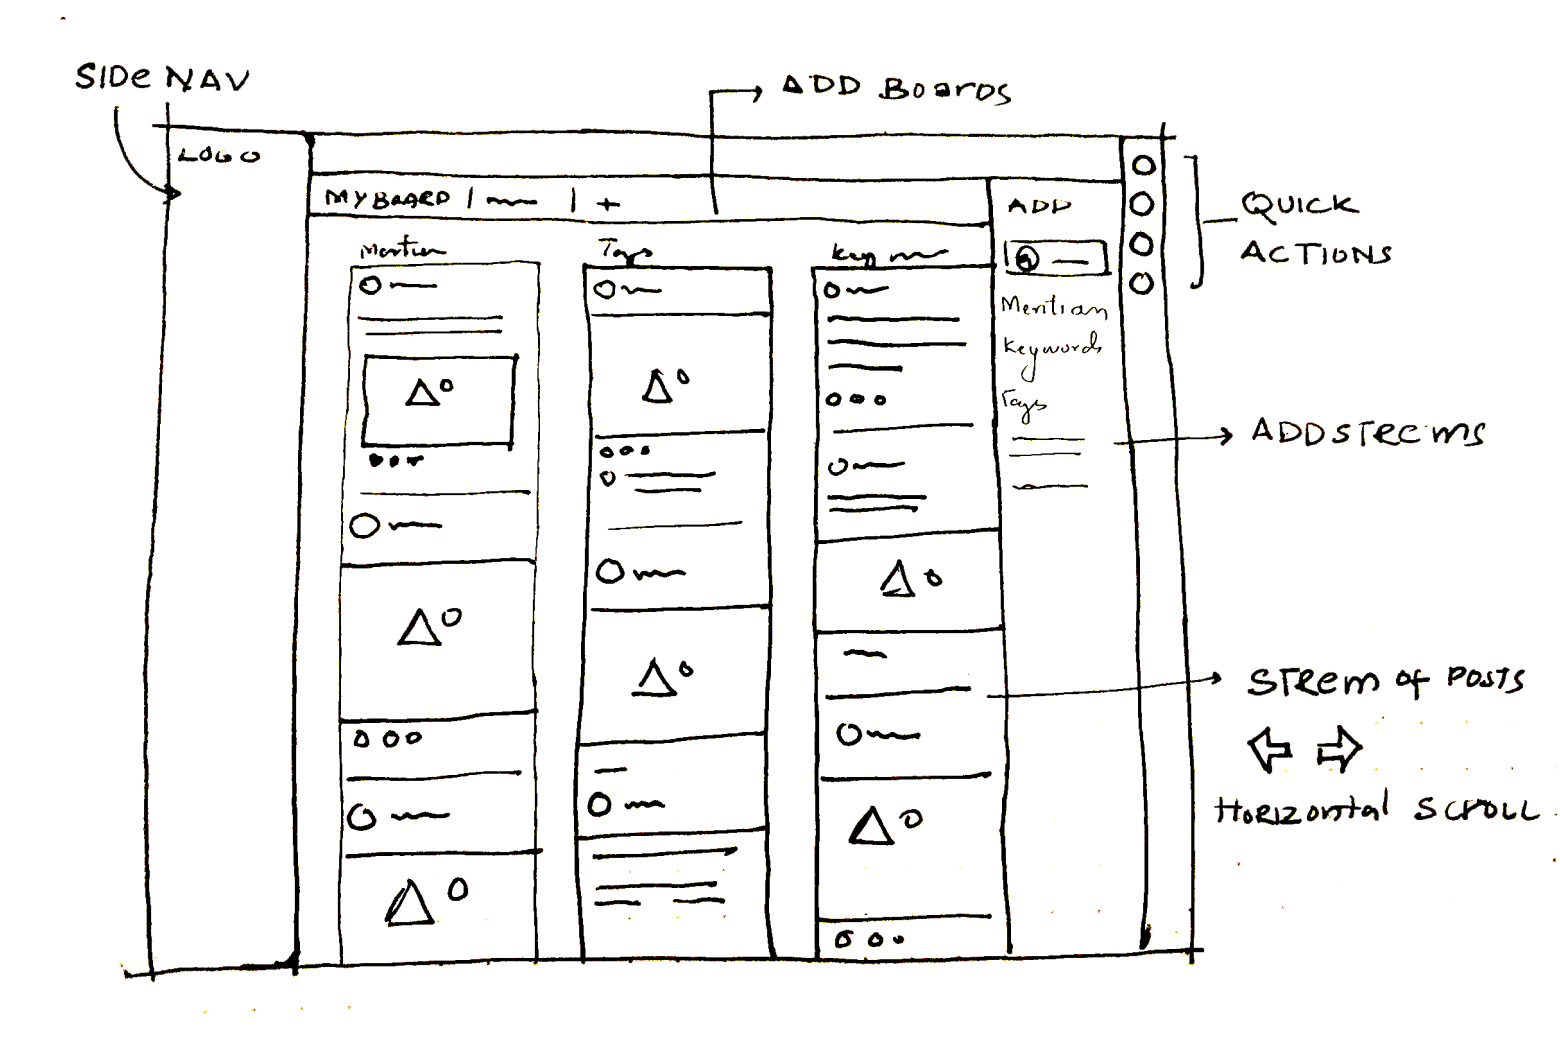
Ideating and wireframe
Prioritizing core user flows, the design centered on the overview, social listening, and new post screens, representing distinct functional areas. Other screens, such as analytics and insights, share similar design to overview .
Design


Visual design
Primary
Secondary
Accent
Greyscale
Success
Eror
Warning
info
SellerSphere
Typography
Heading 1
Source Sans Pro Semibold 24
Heading 2
Source Sans Pro Semibold 20
Heading 3
Source Sans Pro Semibold 16
Button
Roboto Flex medium 16
Body
Roboto Flex regular 16
labels
Poppins regular 13
Captions
Poppins regular 10

Designing for the Social Seller: Crafting SellerSphere
This section delves into the design process of SellerSphere, focusing on how user insights were translated into a functional and intuitive platform.
Onboarding
To tailor SellerSphere to individual needs, the onboarding process began with understanding user roles, company size, and goals. Users were guided through initial setup, including social media connections and dashboard preferences, ensuring a quick start.

Social Media World at a Glance
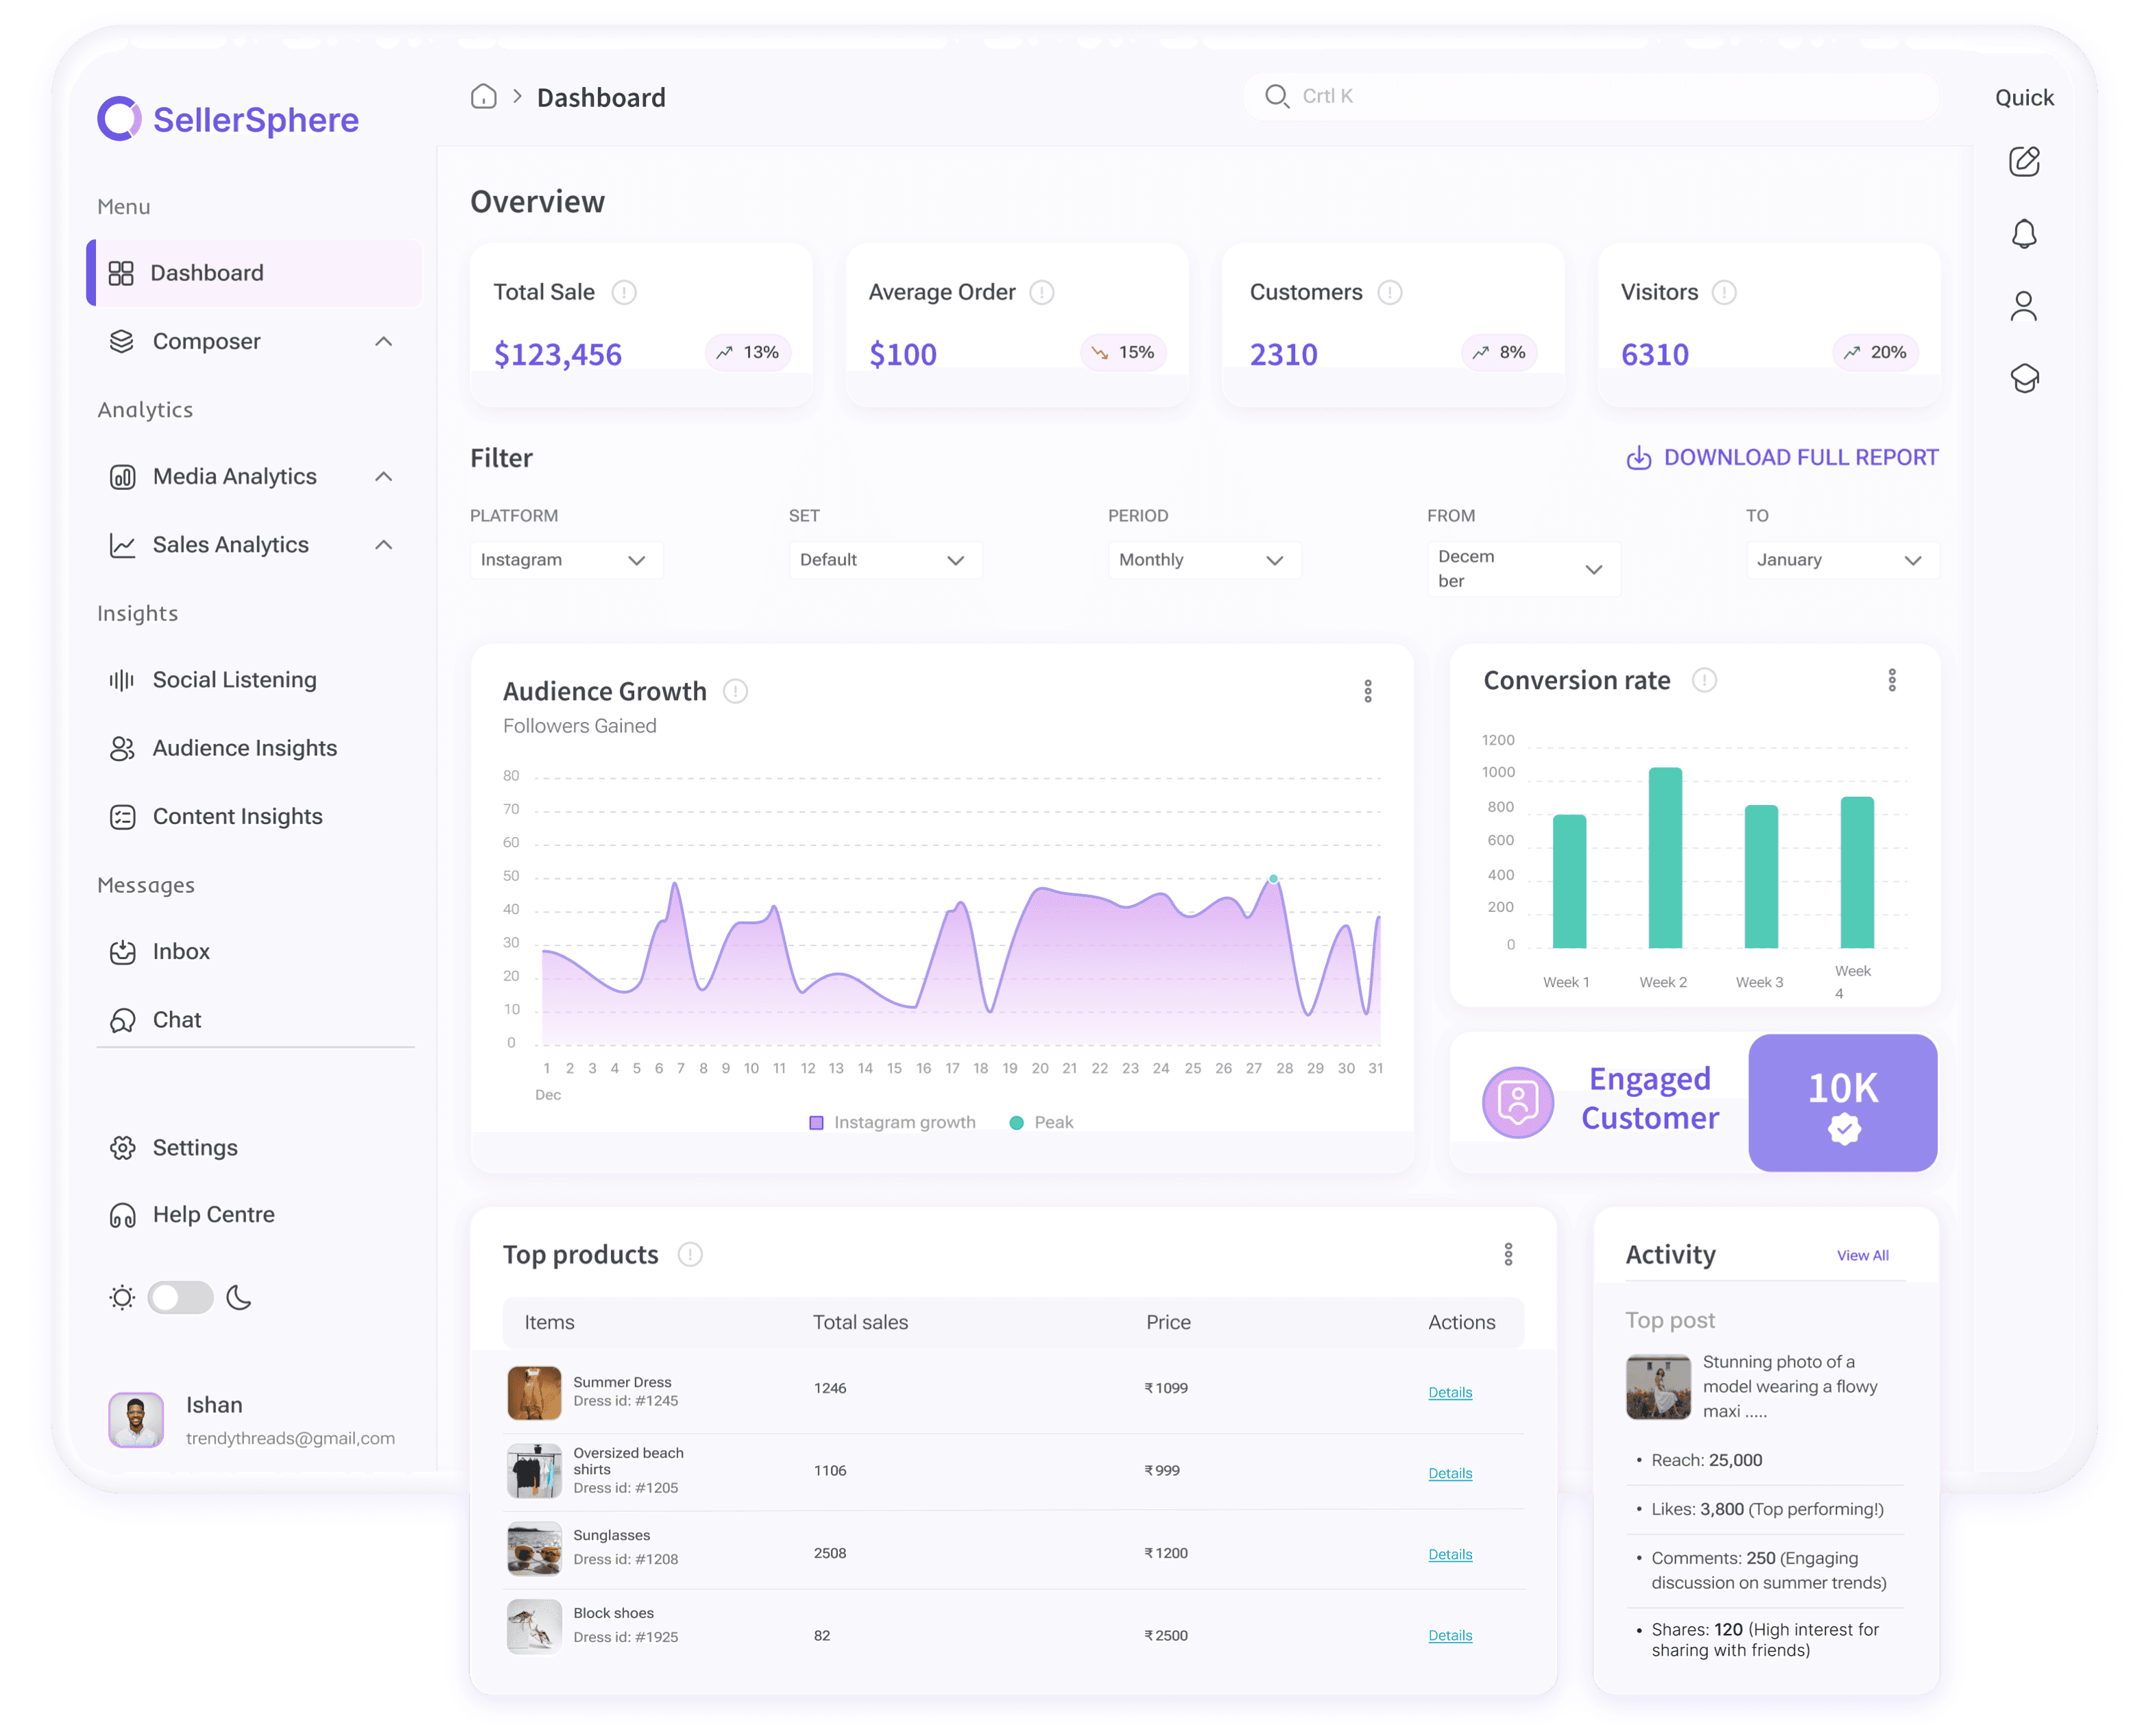
Get a quick overview of your social media performance with key metrics and insights. Easily navigate to deeper analysis or take action based on the data presented.


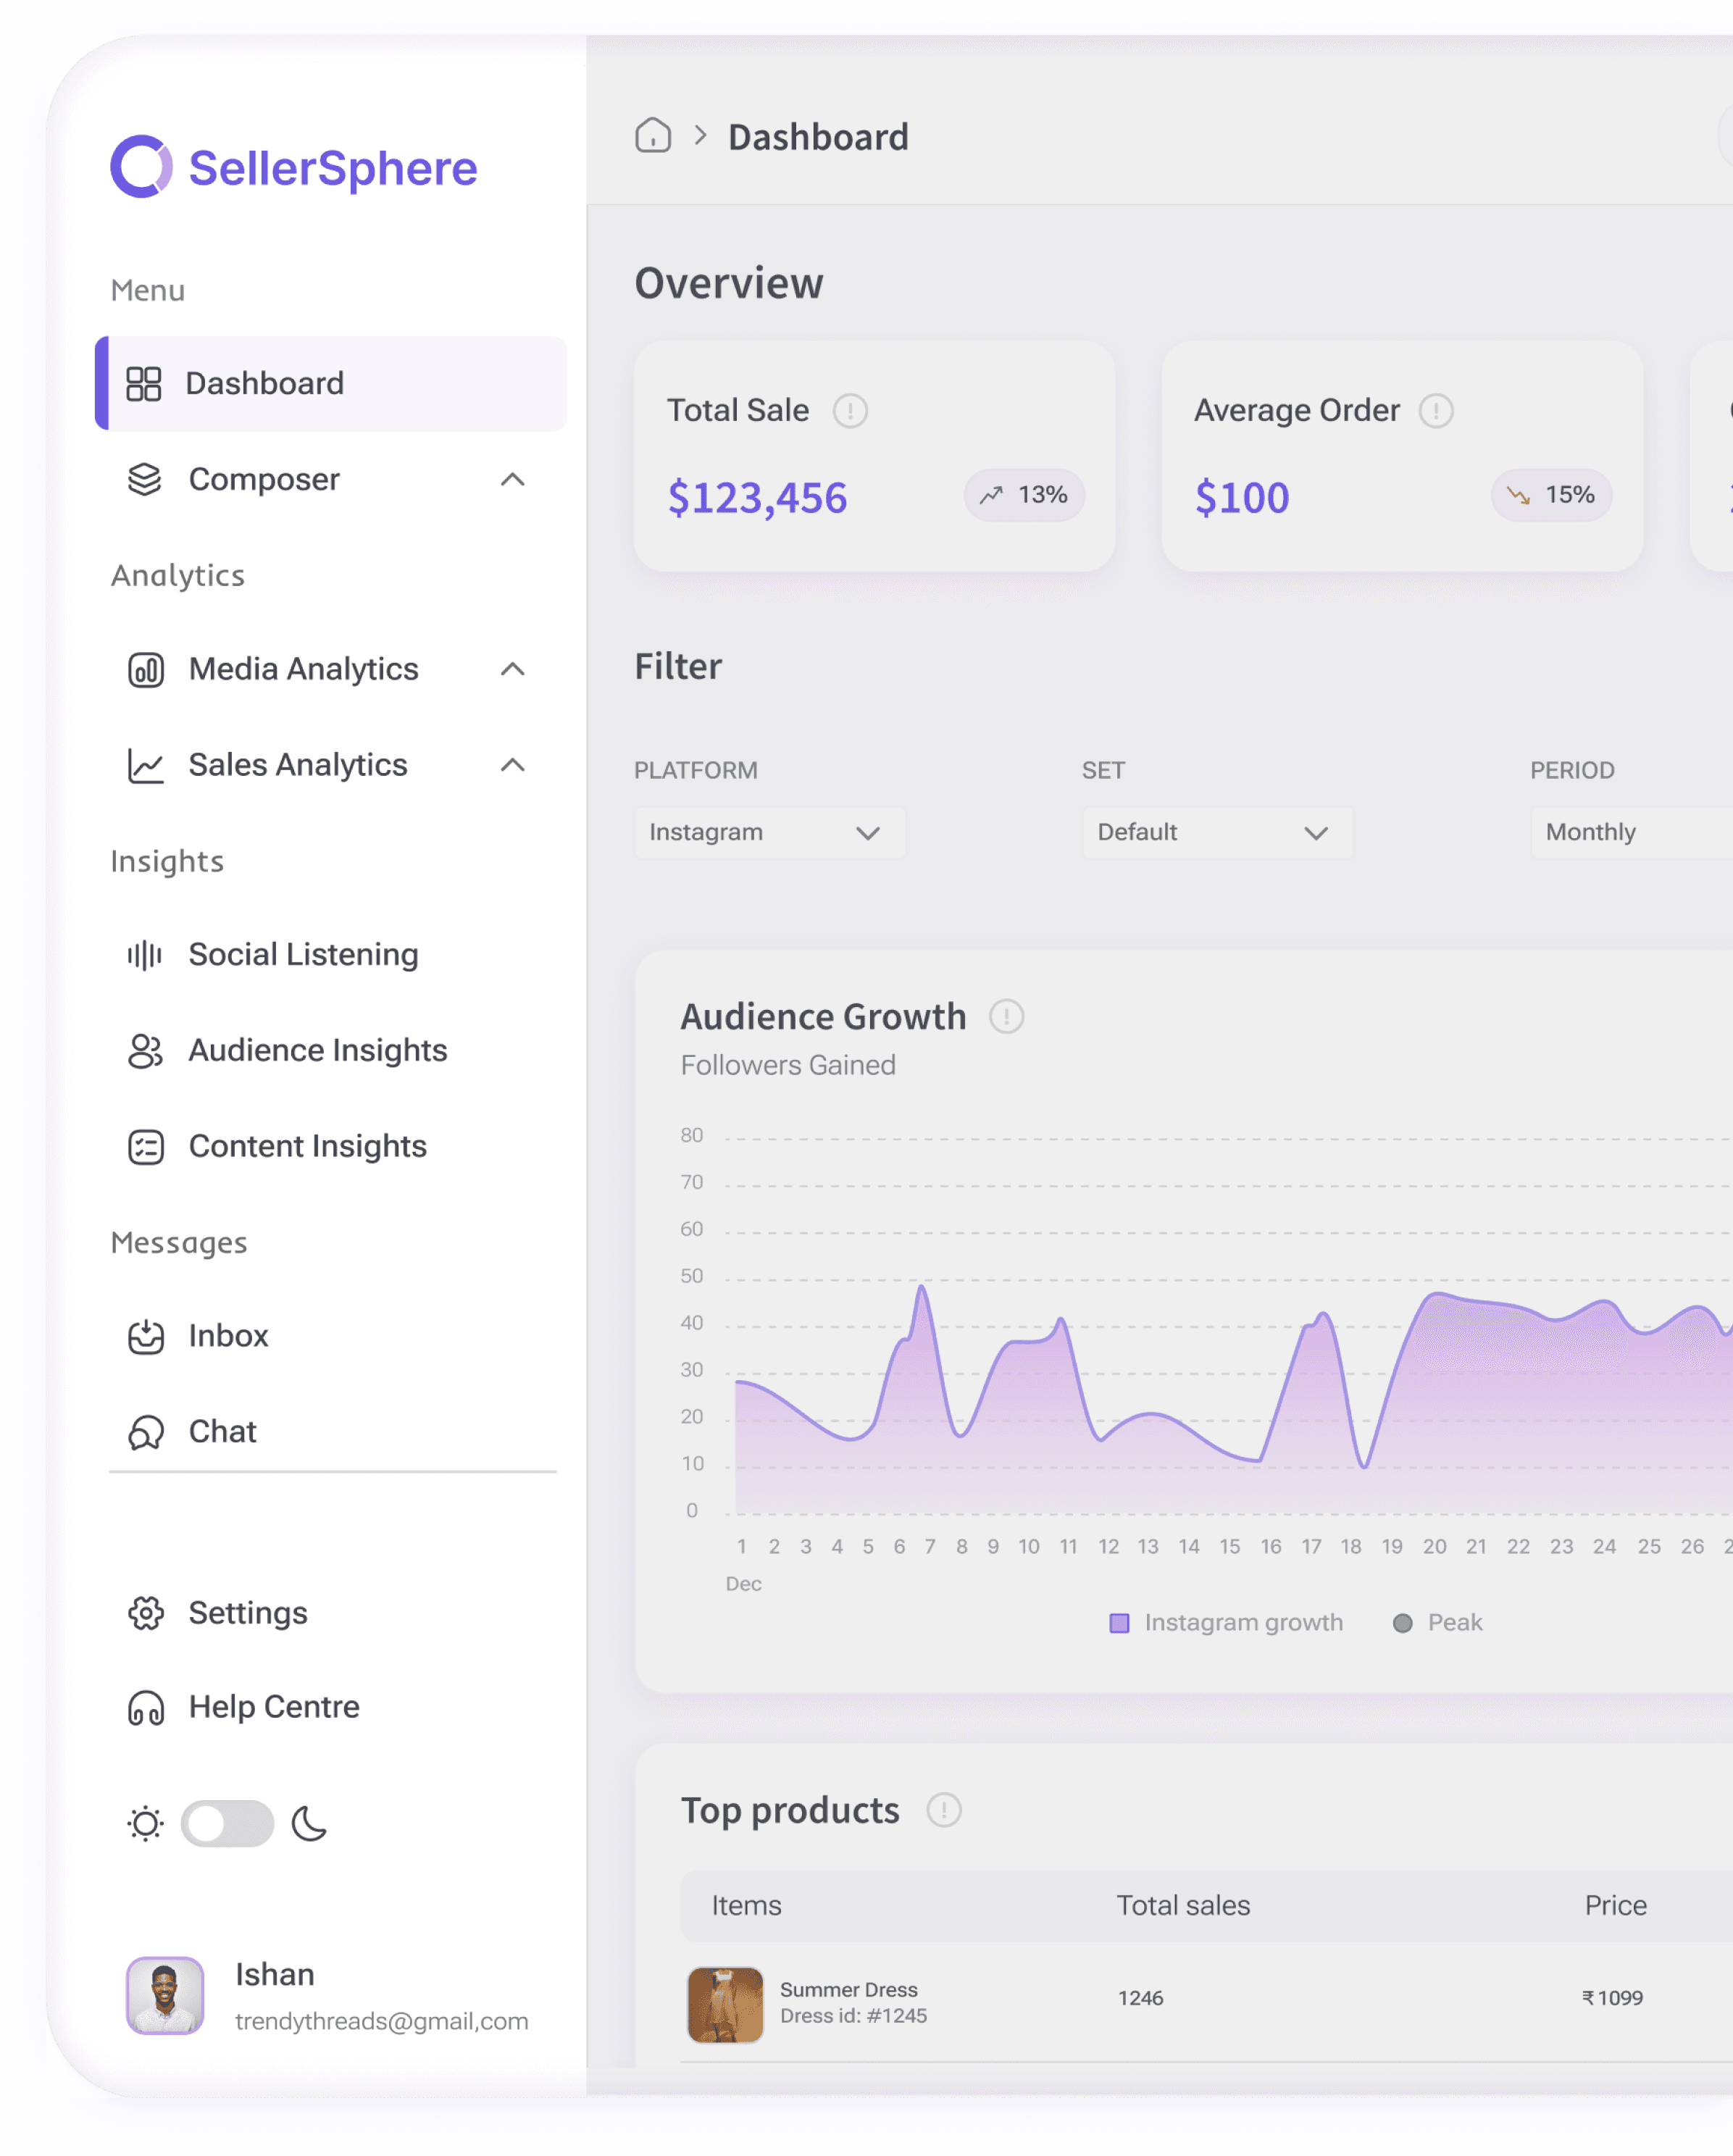
Menu section
Overview of key performance indicators (KPIs).
Composer: Create and schedule social media
Analytics
Dive into performance metrics and insights.
Insights
Explore audience, social listening, and content performance.
Messages
Manage direct messages and team communications.
Settings
Customize user preferences, manage account settings, and control data privacy.
Global Search: Effortlessly find specific data, posts, or insights across the platform
Efficiently move between Quick Actions & help.
Displays the cumulative sales generated and average value per transaction. Shows the total number of customers and website visitors.
Visualizing follower growth and customer acquisition efficiency and Highlighting top-performing products and active customer base.

Composer: Your Content Creation Hub
Create, schedule, and manage your social media content with ease. From crafting engaging posts to optimizing posting times, the Composer empowers you to maximize your social media impact.


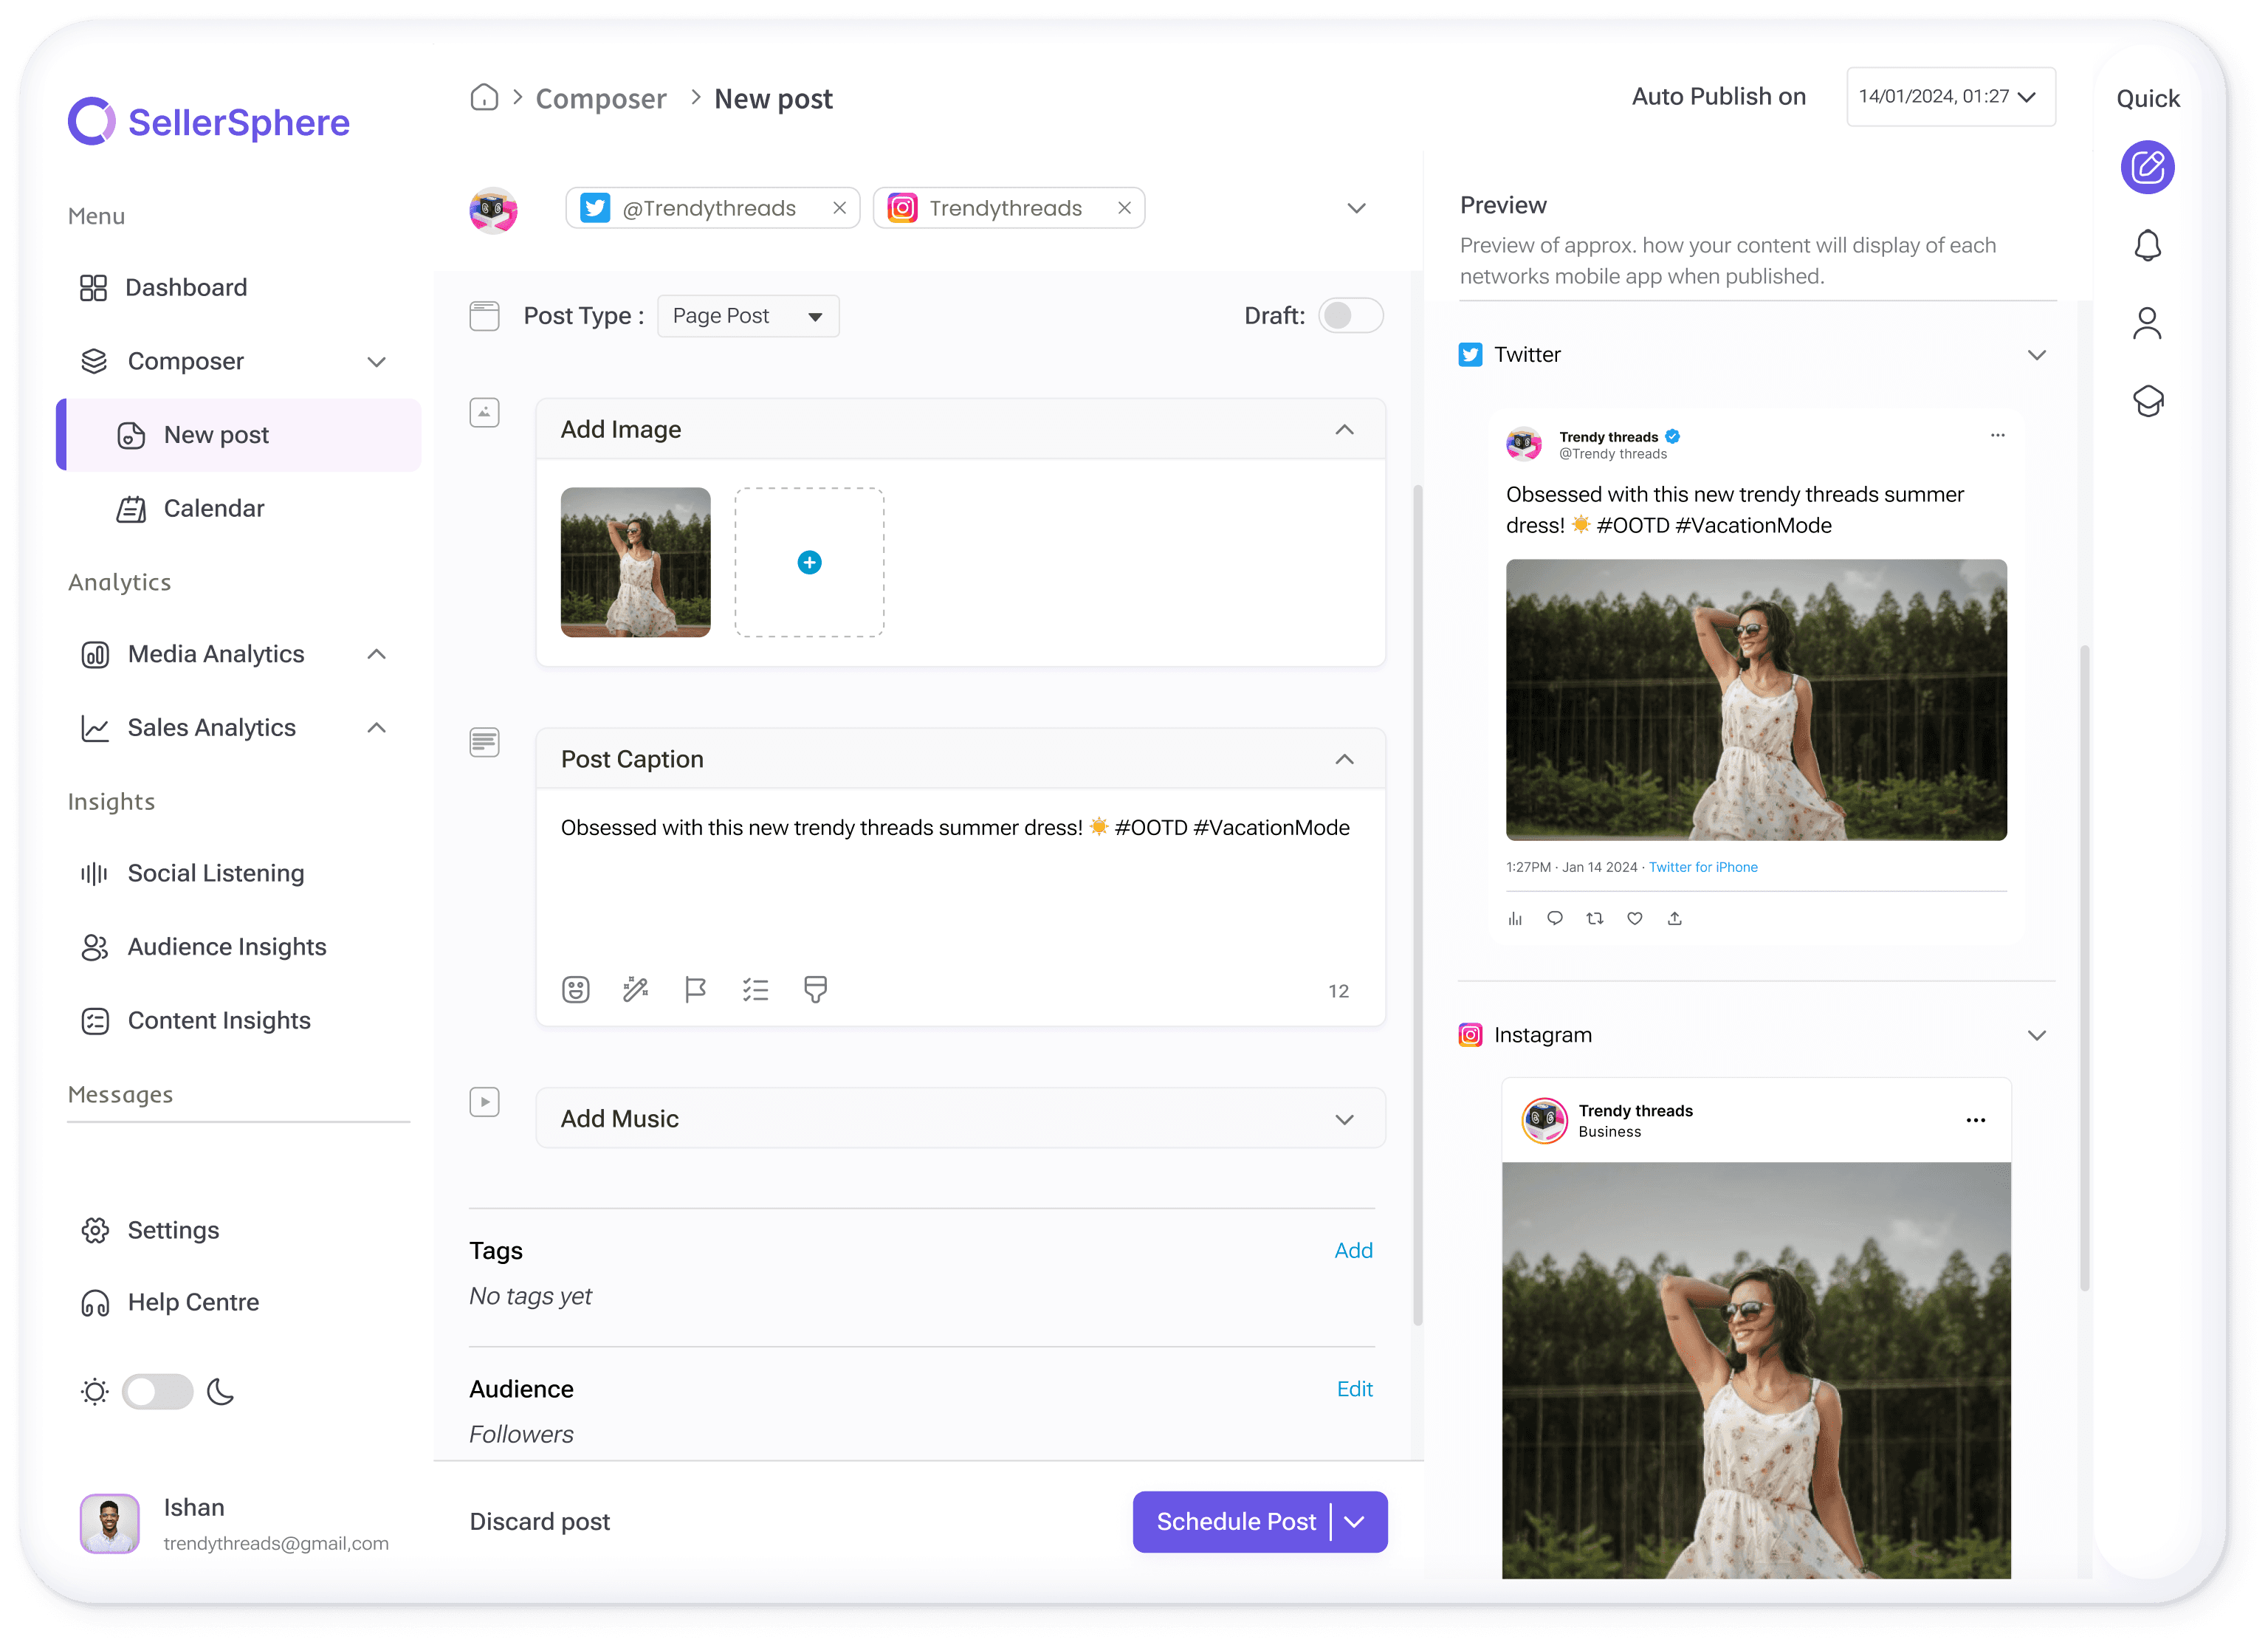
Post Creation: Craft and Conquer
Create engaging posts for multiple platforms in one go. Add text, images, and videos to captivate your audience.
Content Calendar: Plan and Schedule Ahead
Organize your content strategy with a visual calendar. Schedule posts in advance and ensure consistent social media presence.
Multi edit section : Edit your posts here to automate the content creation process
See how your content will look across different platforms before you hit post.
Optimal Time Recommendations: Benefit from data-driven insights to identify the best times to post for your audience.
Pick a date
Dec 12, 2023
Time
09
30
Am
Optimal time
8:30 Am
9:30 Am
12:30 Pm
02:00 Pm
Confirm
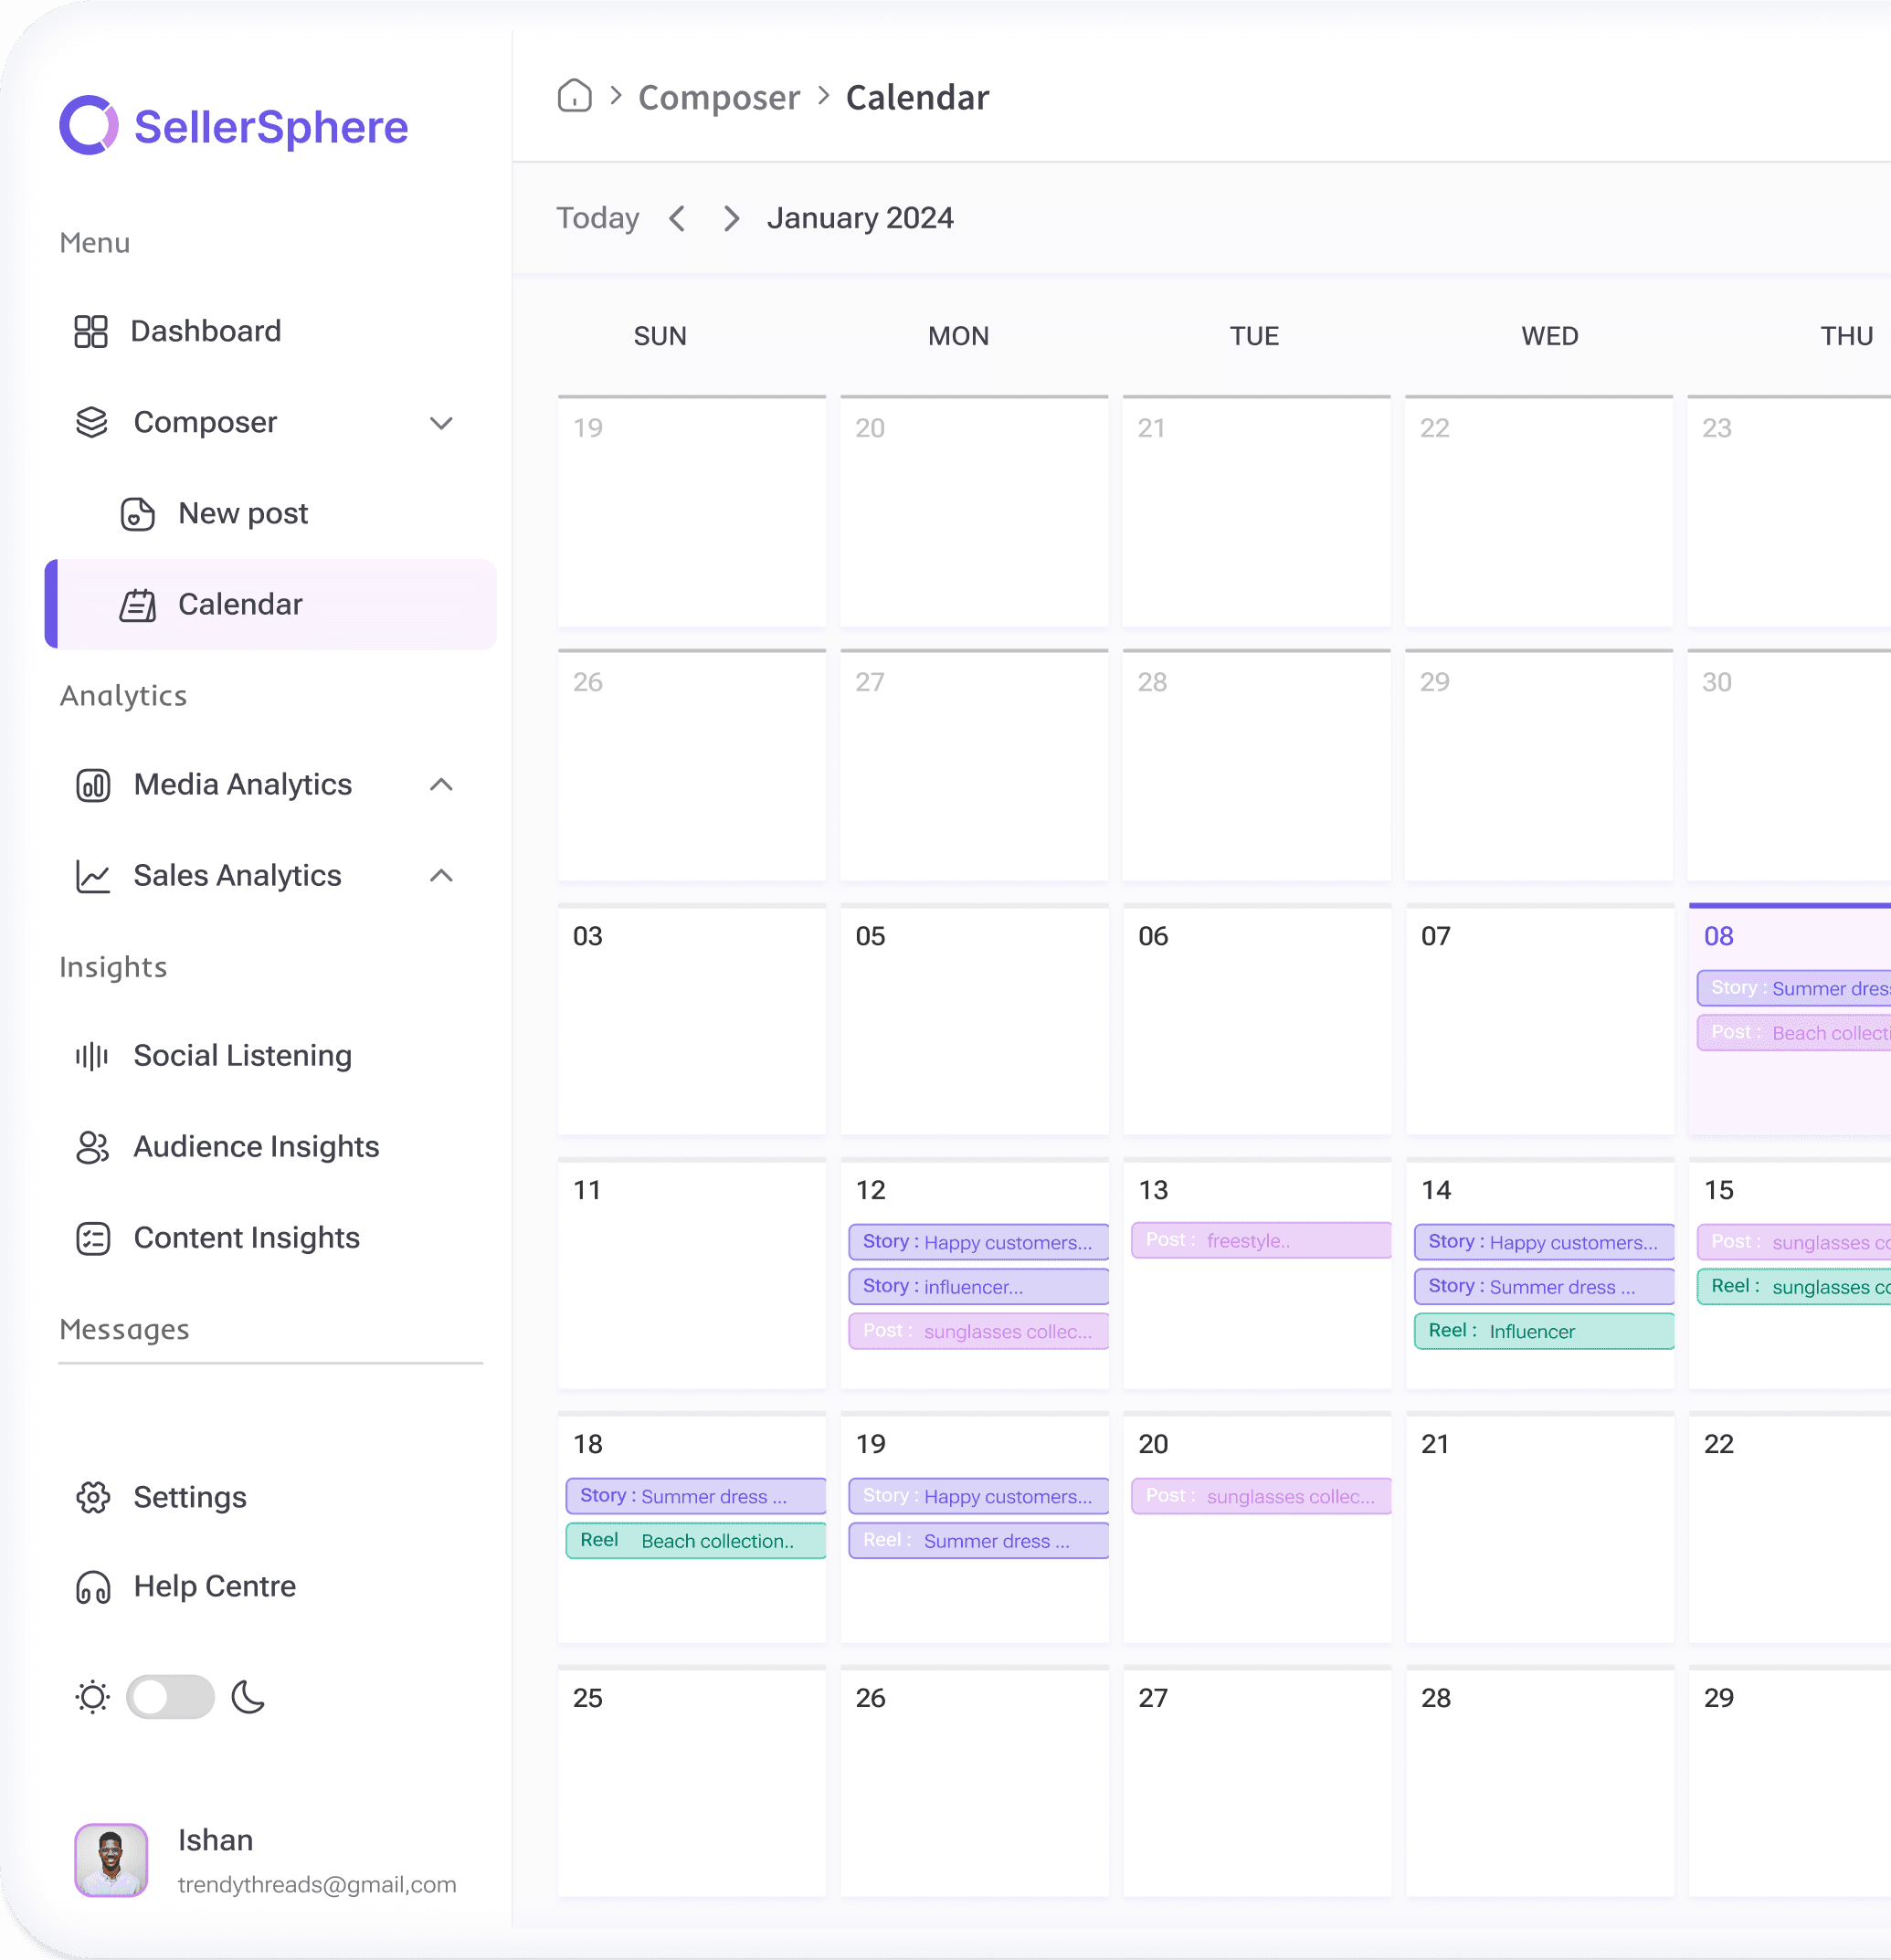
Month View:
Gain a broader perspective on your content calendar. Identify content gaps and plan for seasonal campaigns.
Visualize Your Content:
Differentiate your content types with color-coded calendar blocks. Easily identify image posts, video content, text updates, and more at a glance.
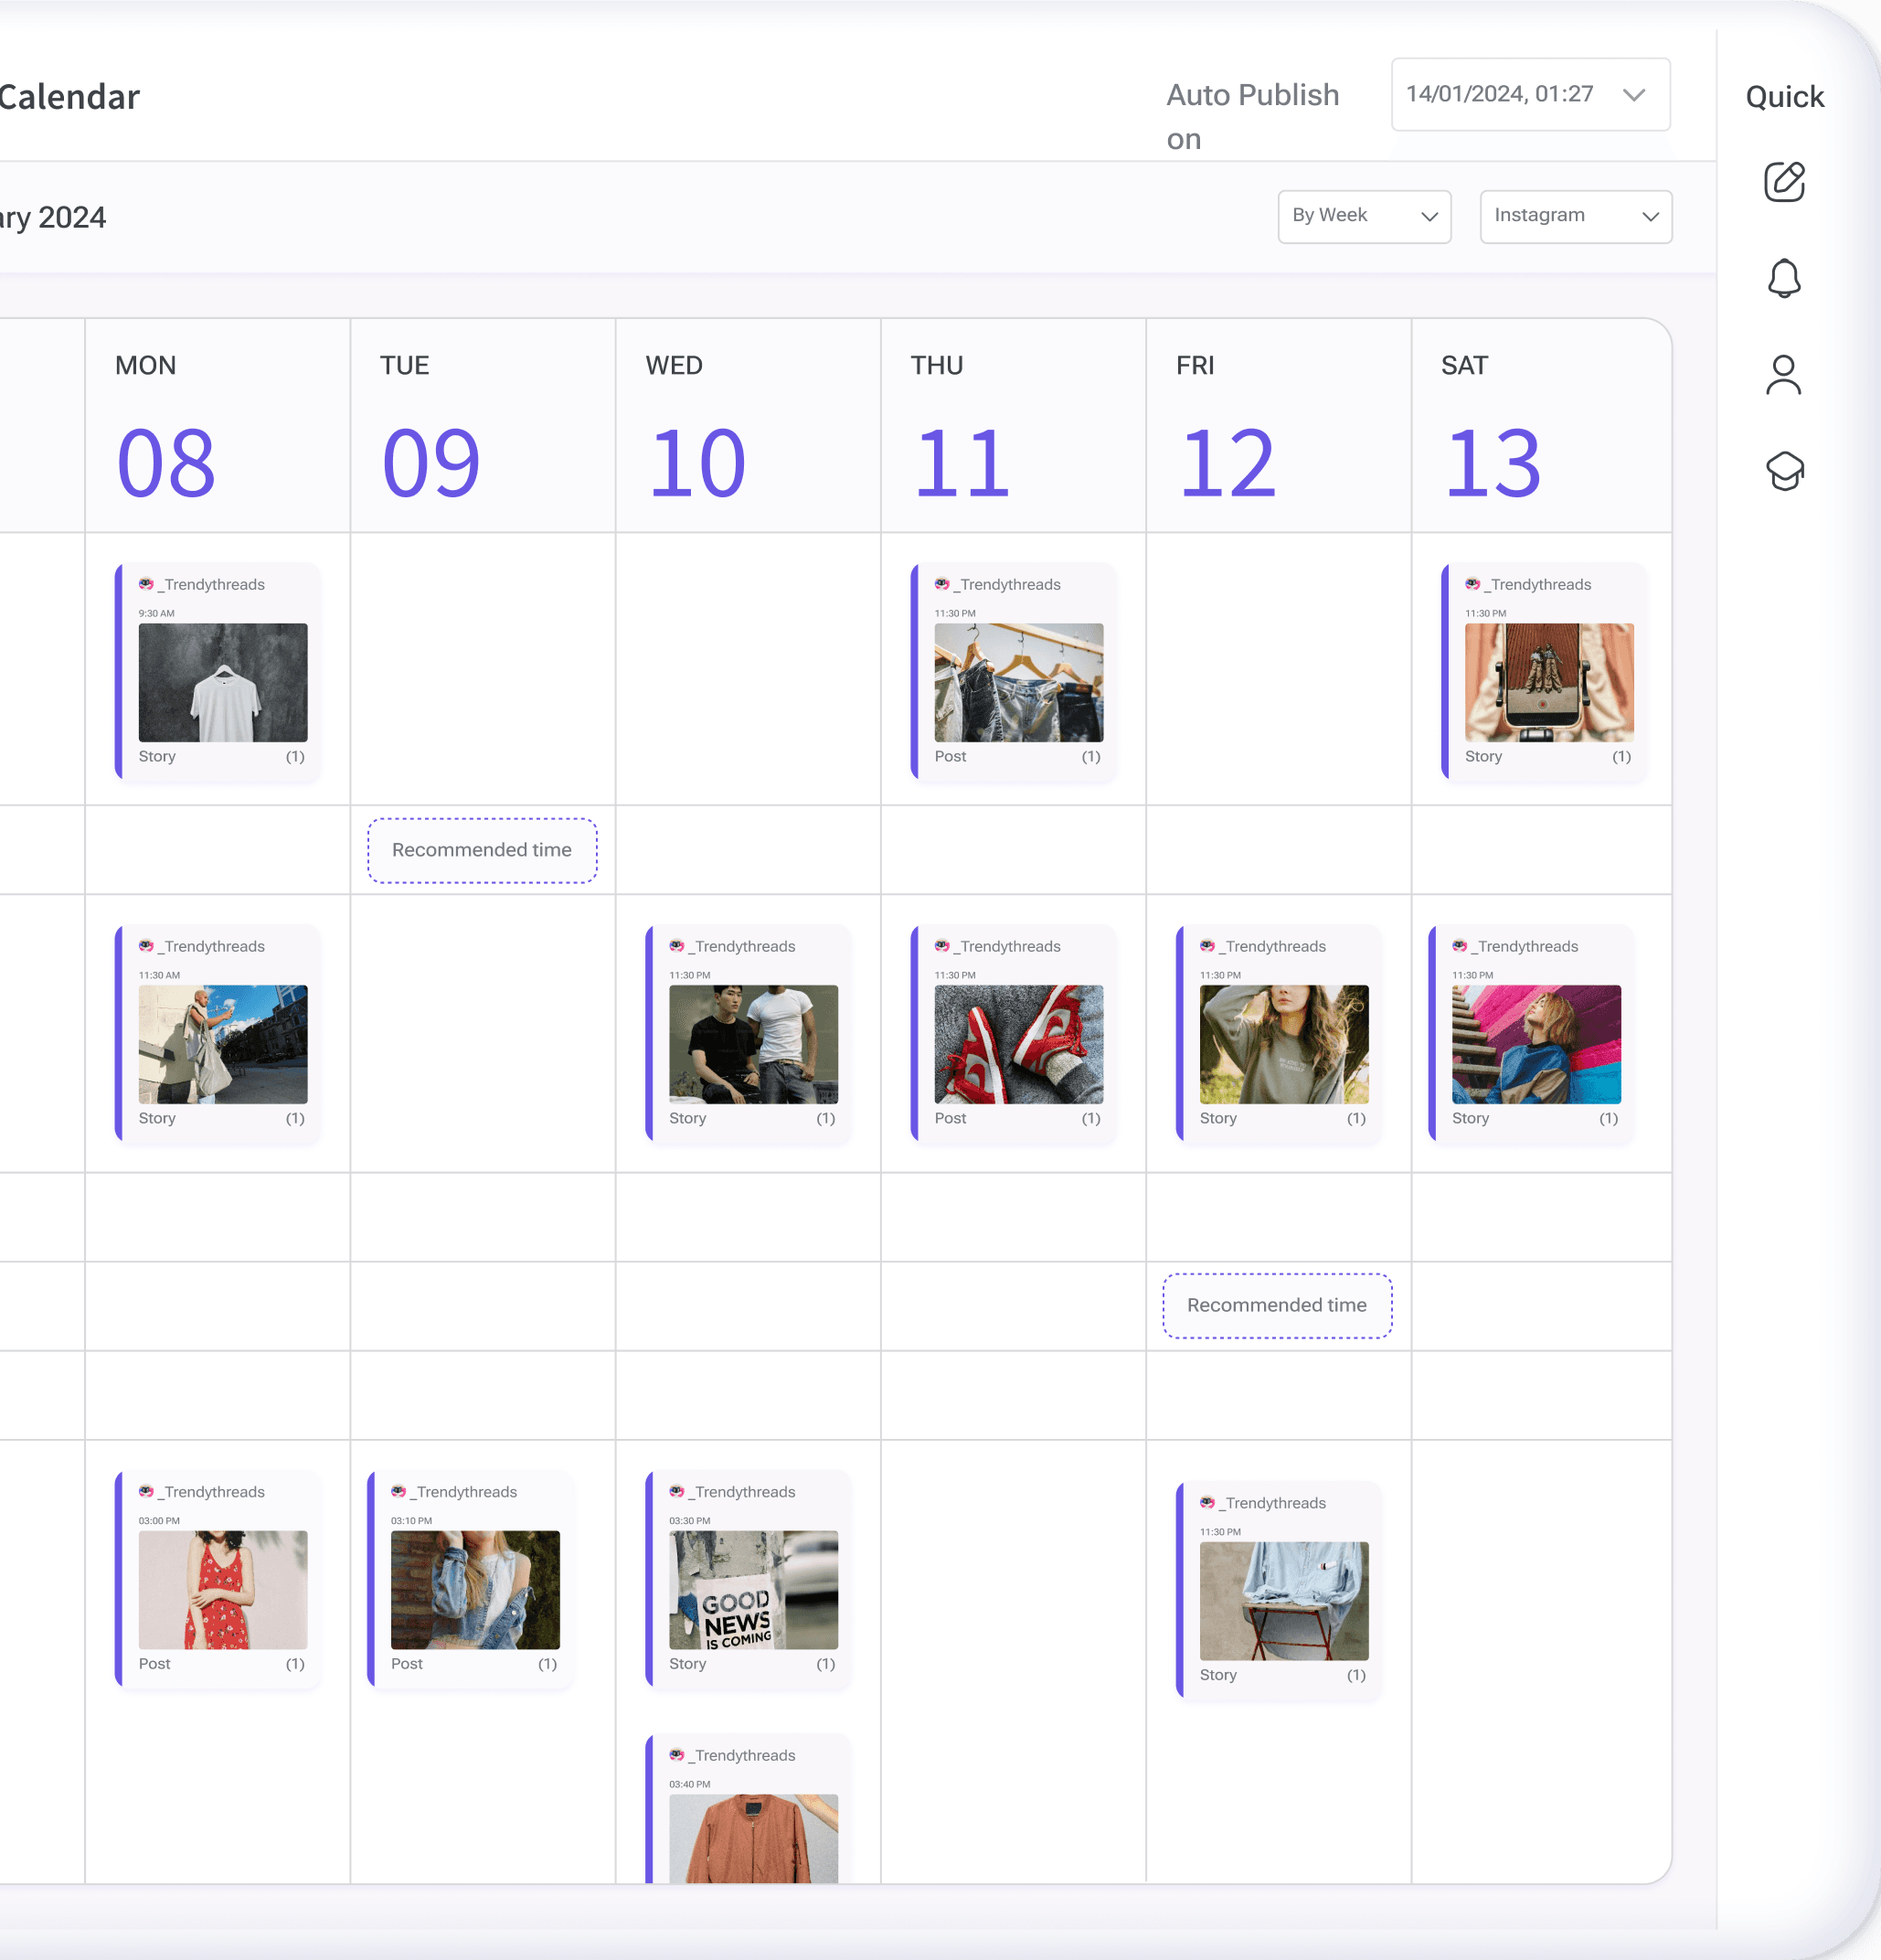
Week View:
Visualize your content schedule day-by-day. Easily identify optimal posting times based on audience engagement patterns.

Performance Overview
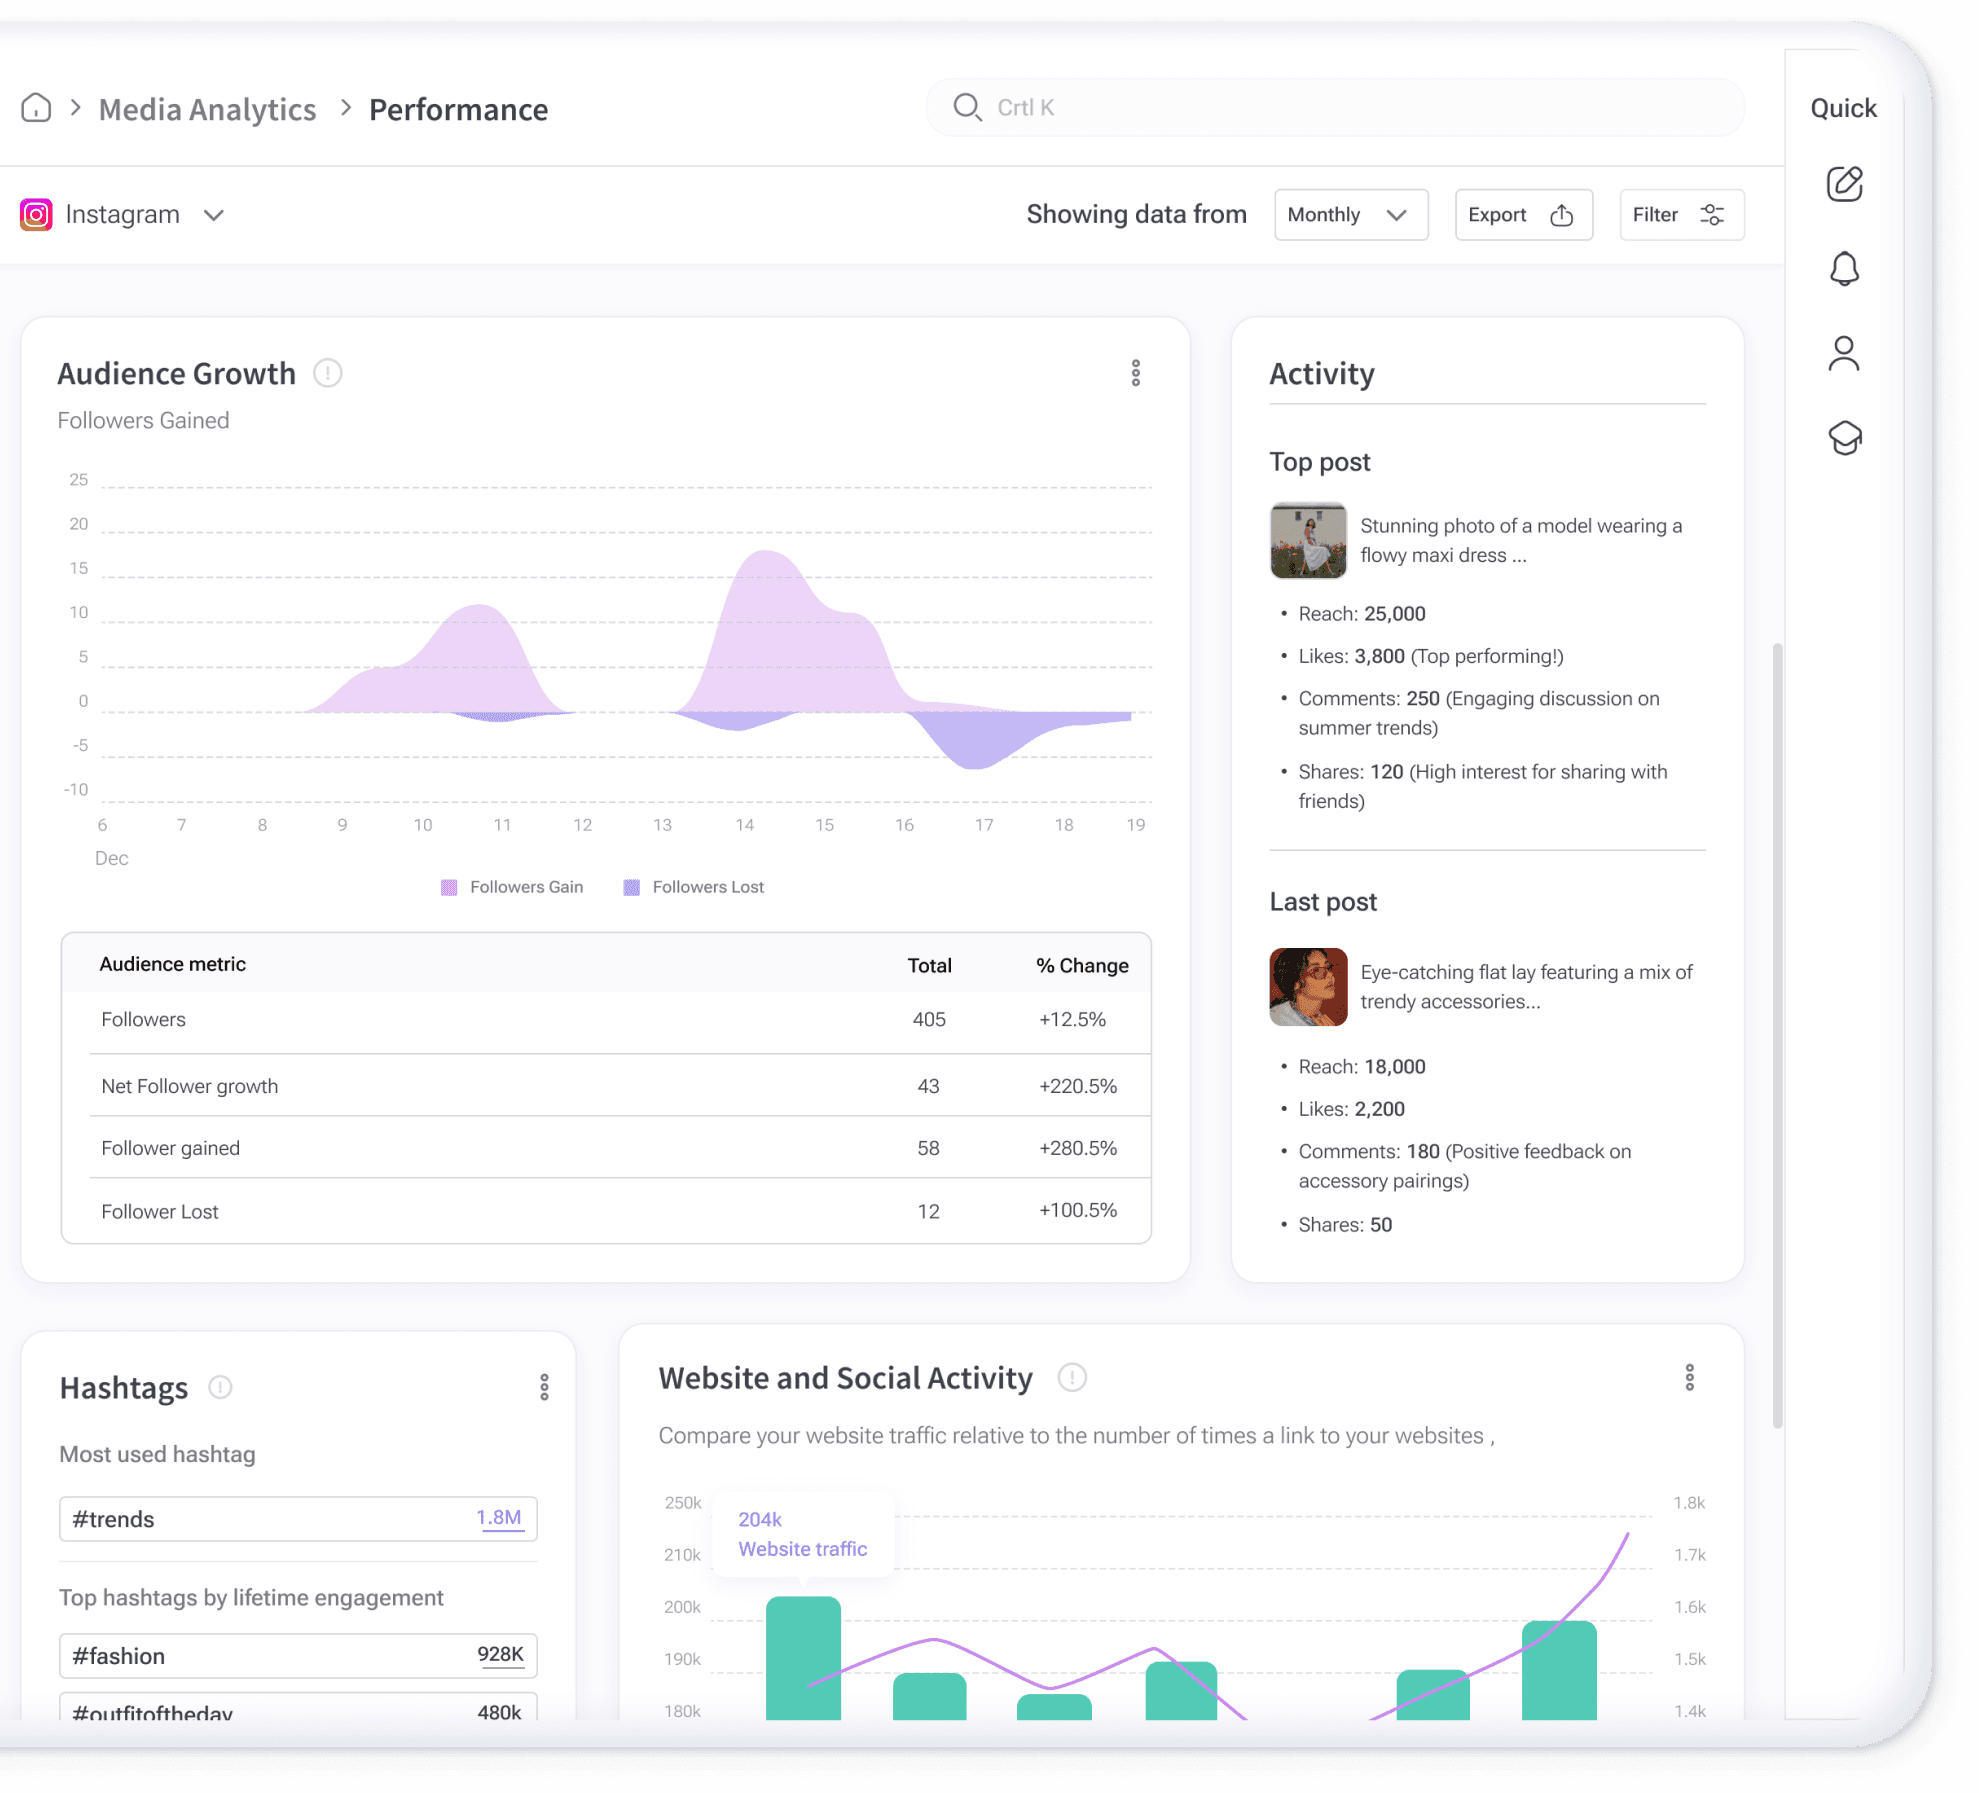
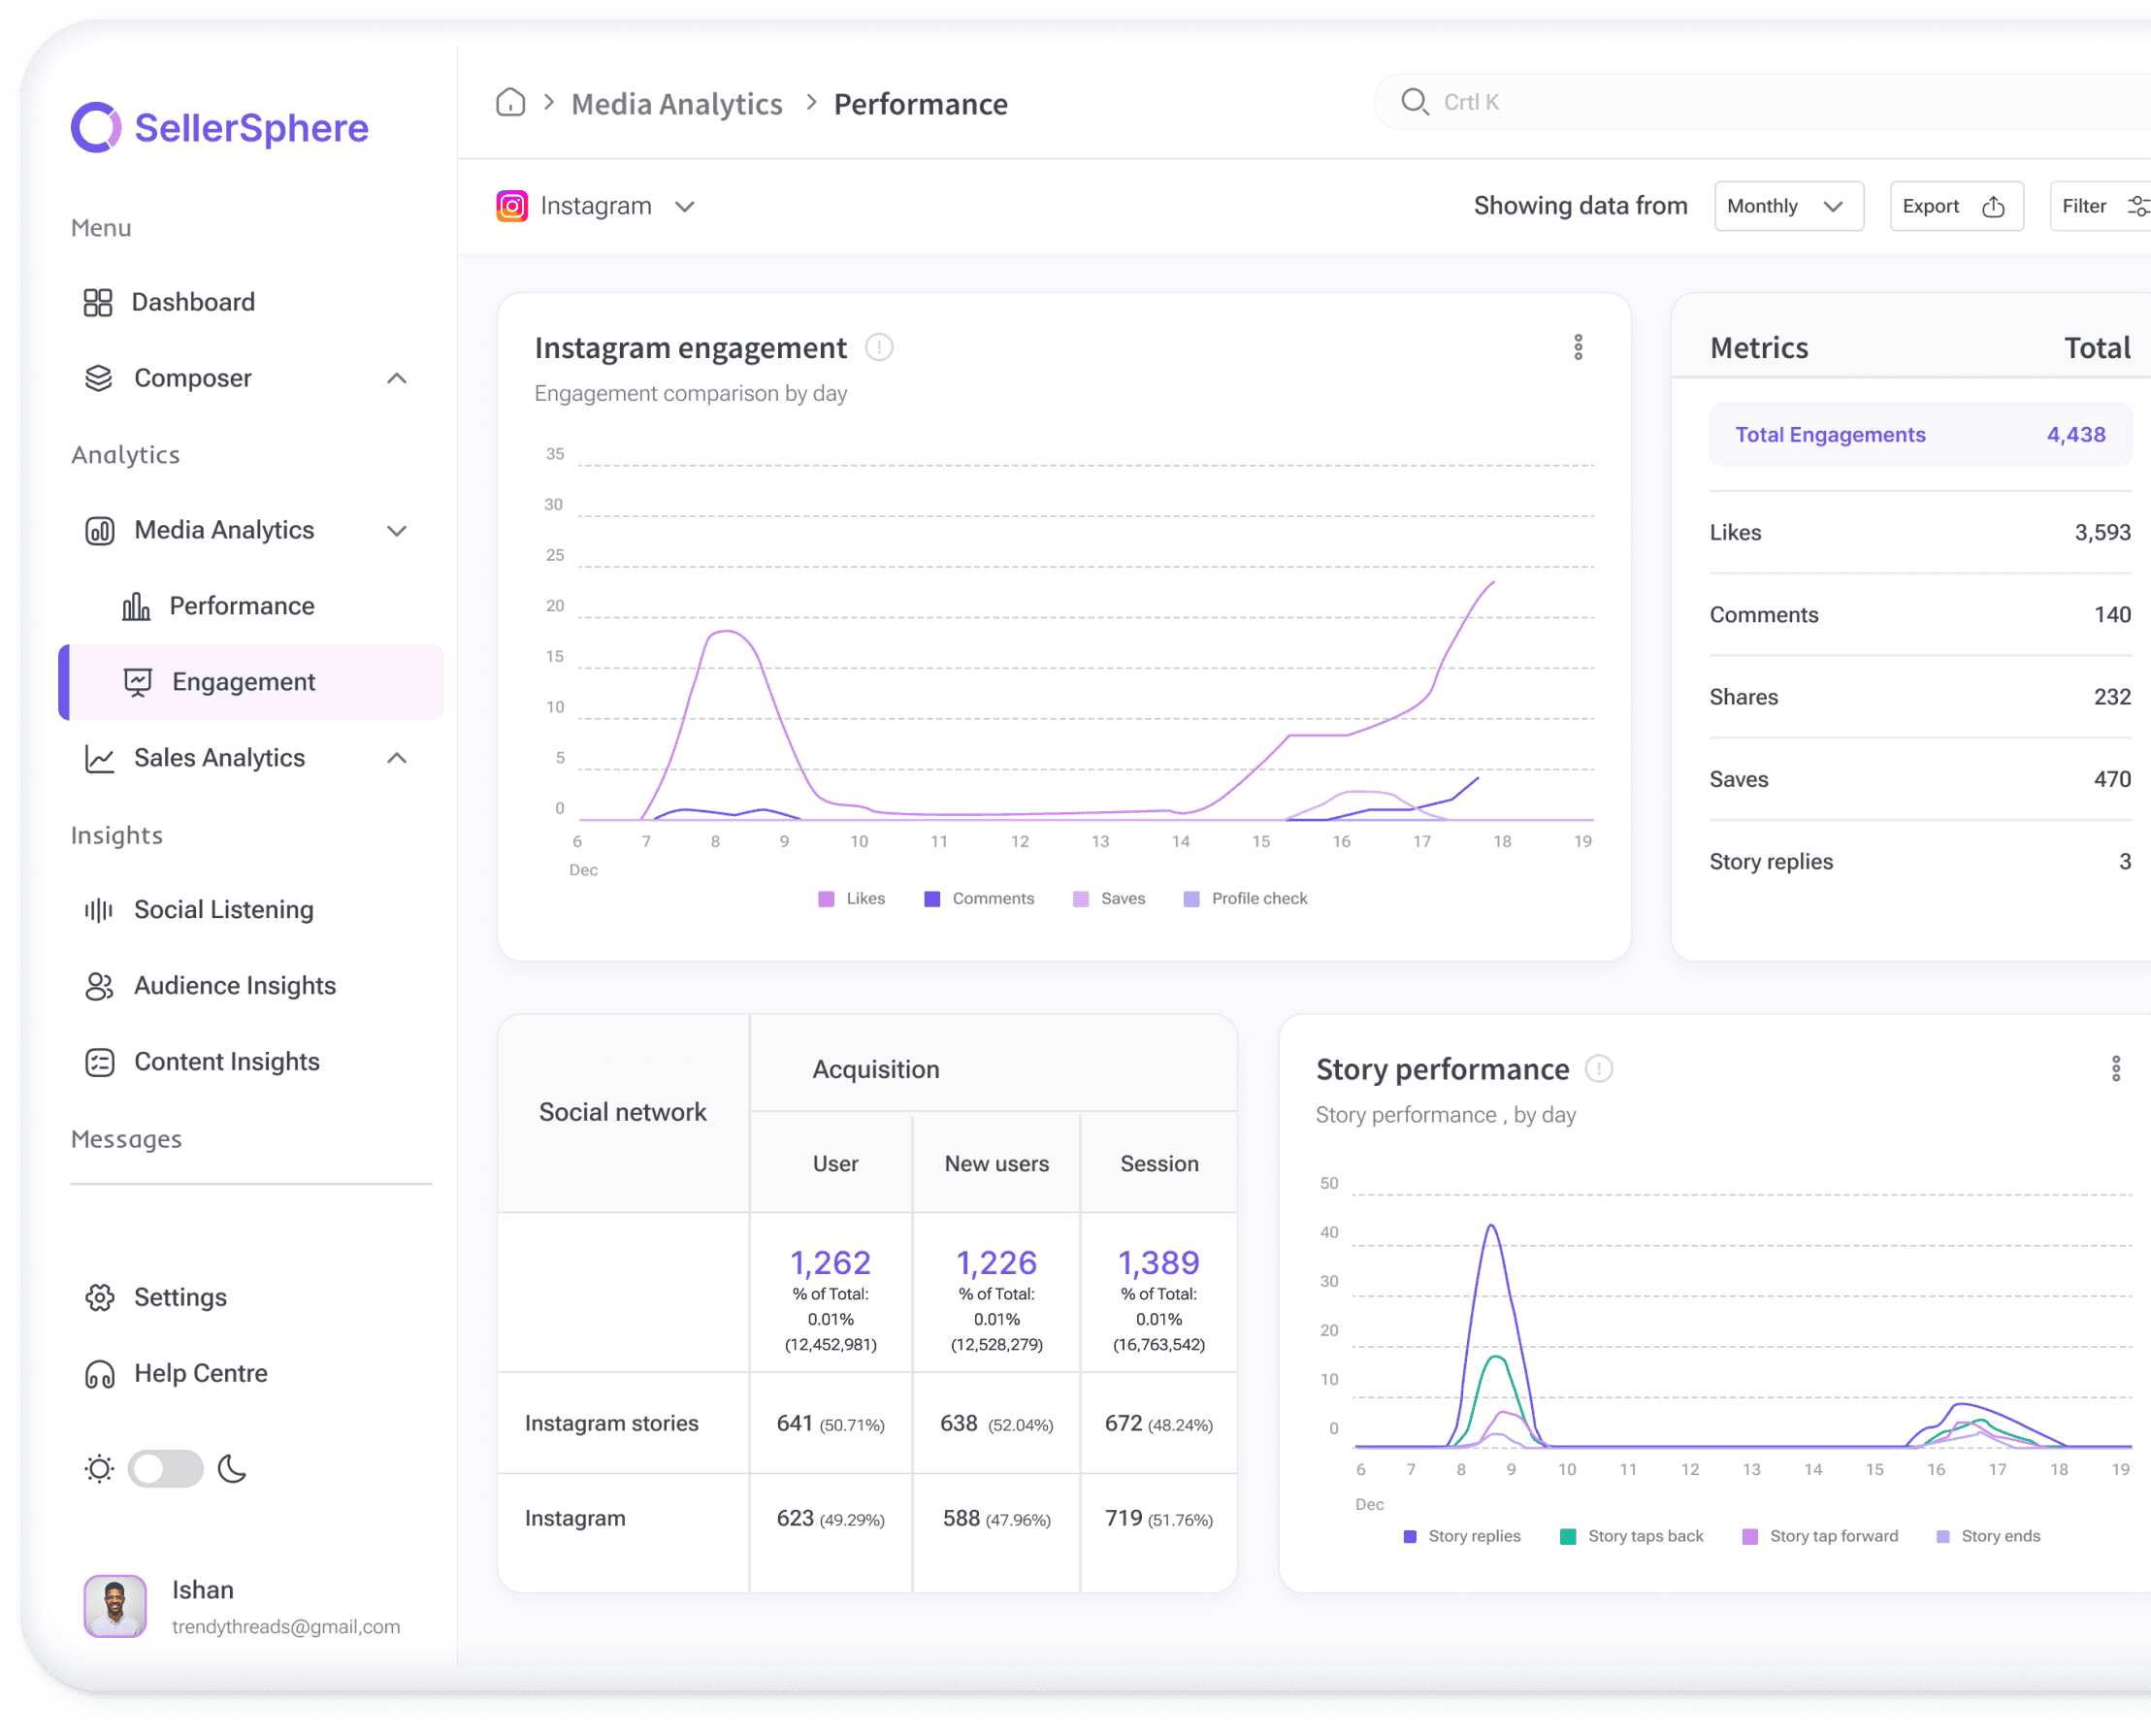
The SellerSphere dashboard offers a comprehensive view of social media performance. Key metrics like total reach, engagement rate, and conversion rate are presented visually to enable quick insights. Users can delve deeper into media, social, sales, and content analytics to uncover trends, identify opportunities, and optimize campaigns.


Media Analytics:
Uncover the performance of your social media campaigns across platforms. Analyze metrics like impressions, reach, engagement, and click-through rates to optimize content strategy.
Sales Analytics:
Measure the impact of social media on sales. Track conversions, revenue generated, and customer acquisition costs to optimize ROI.
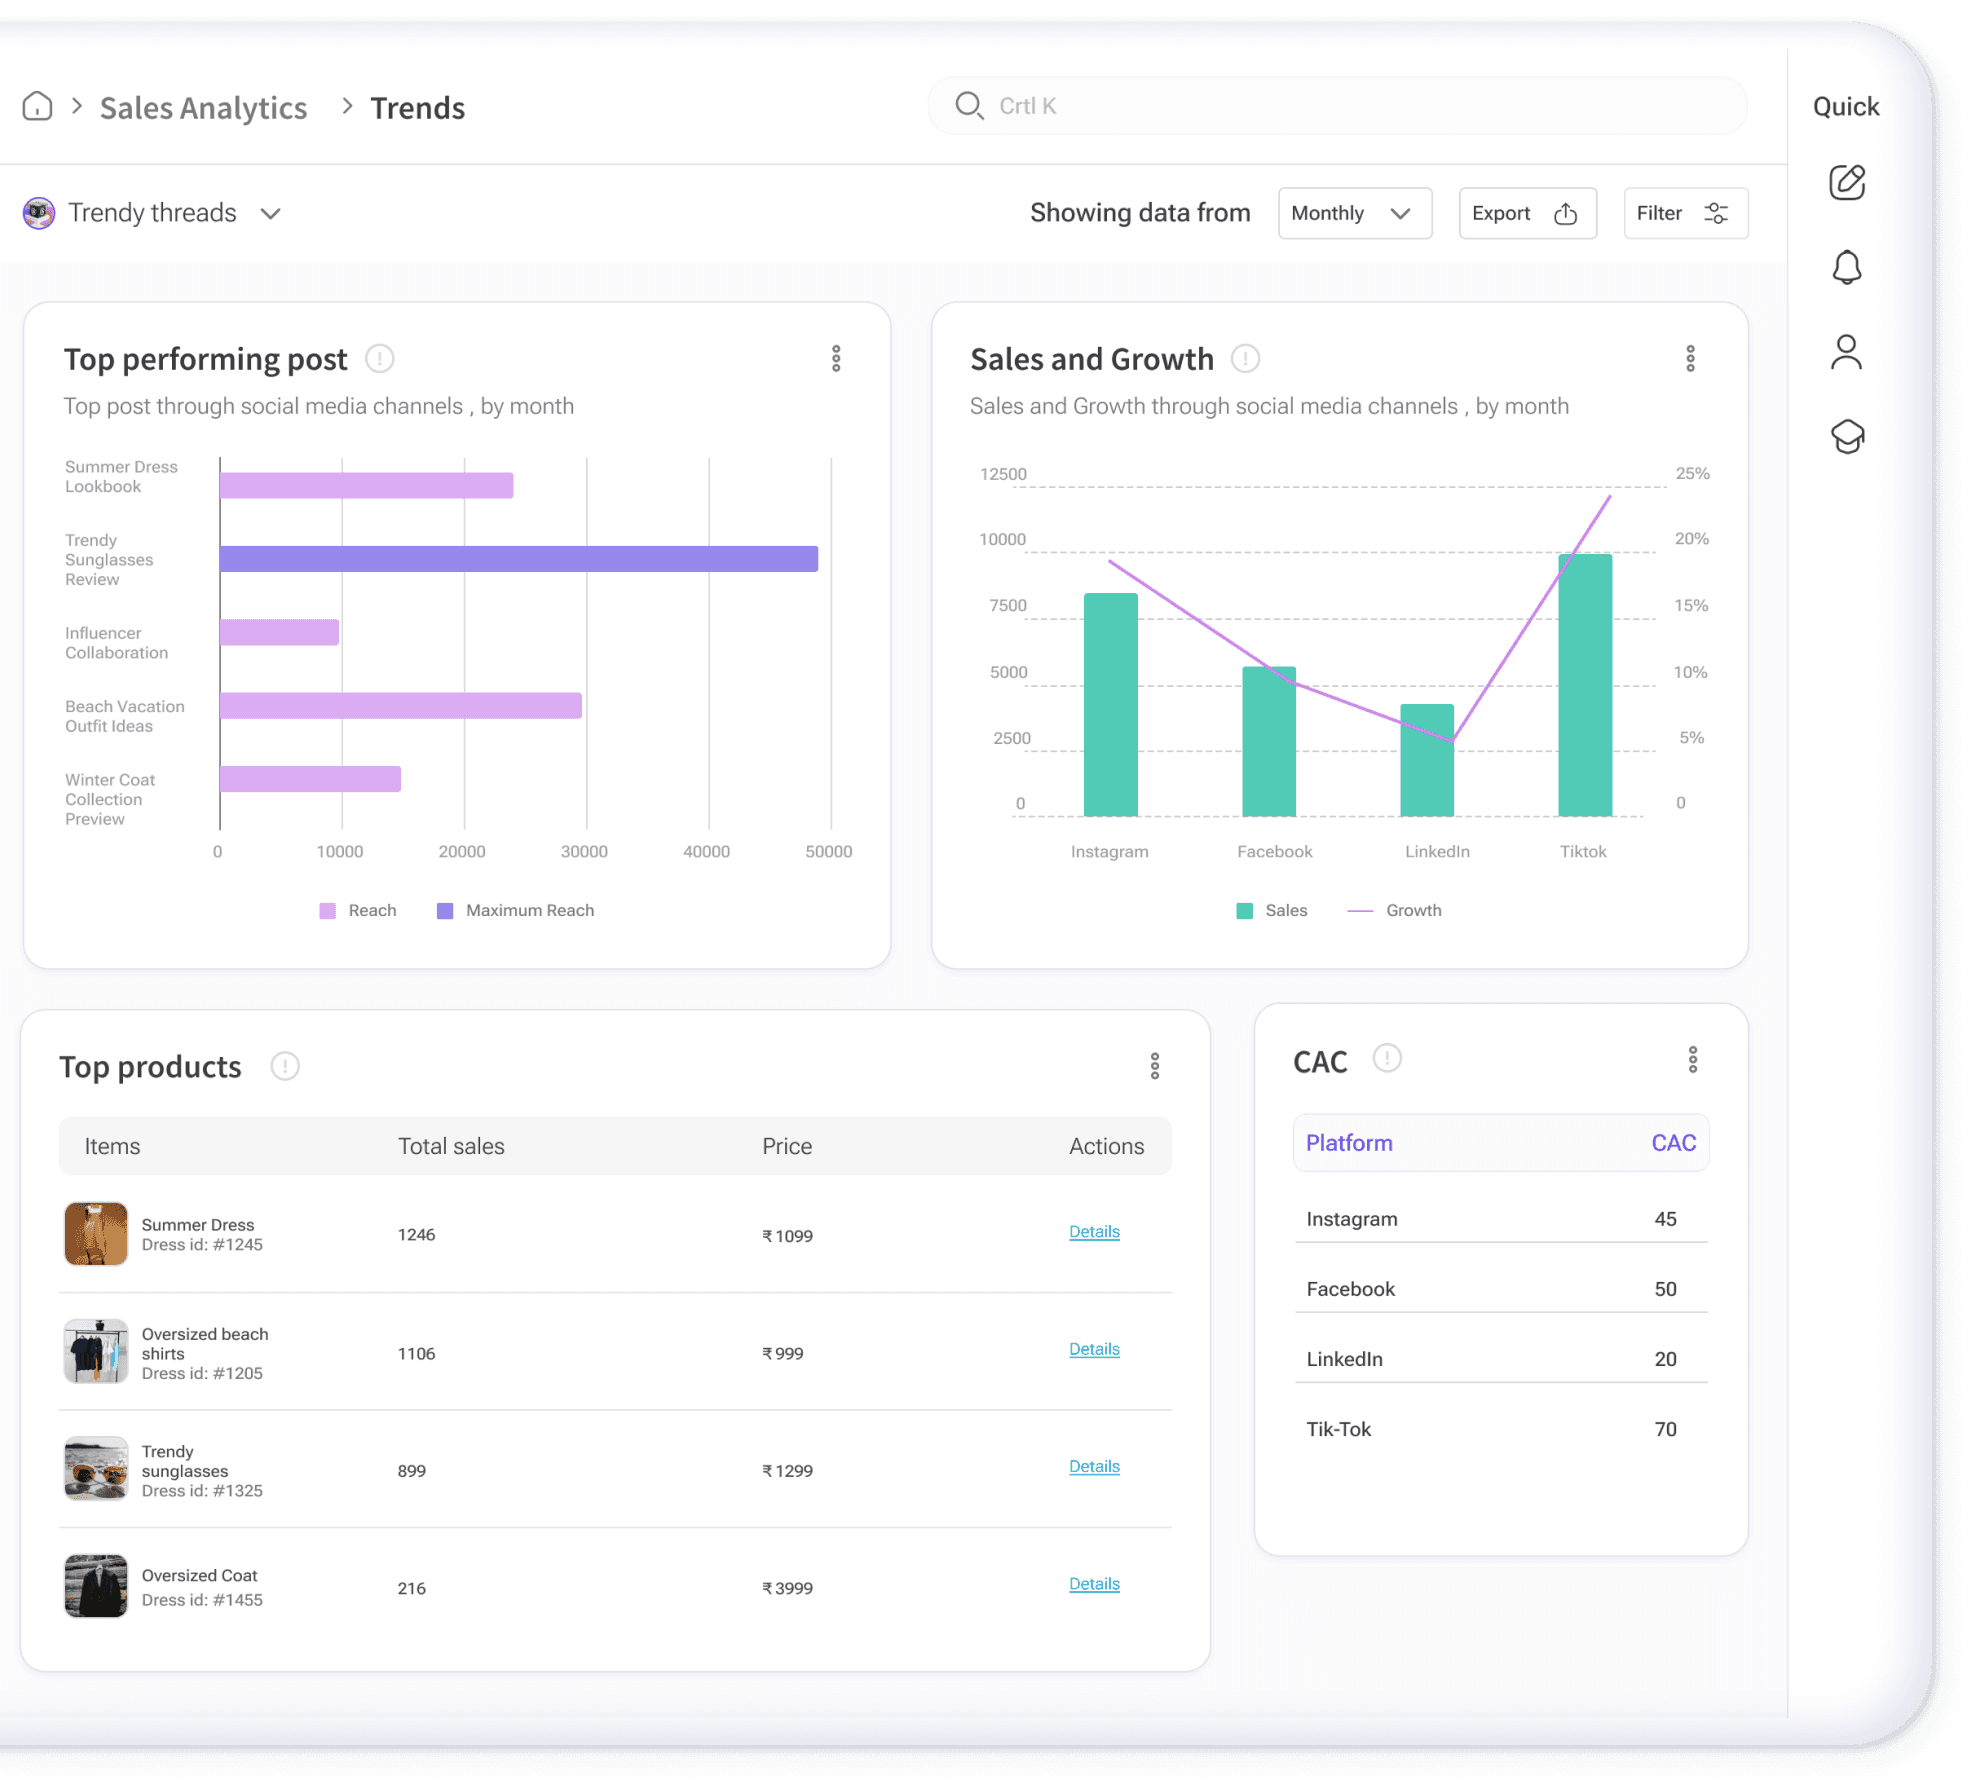
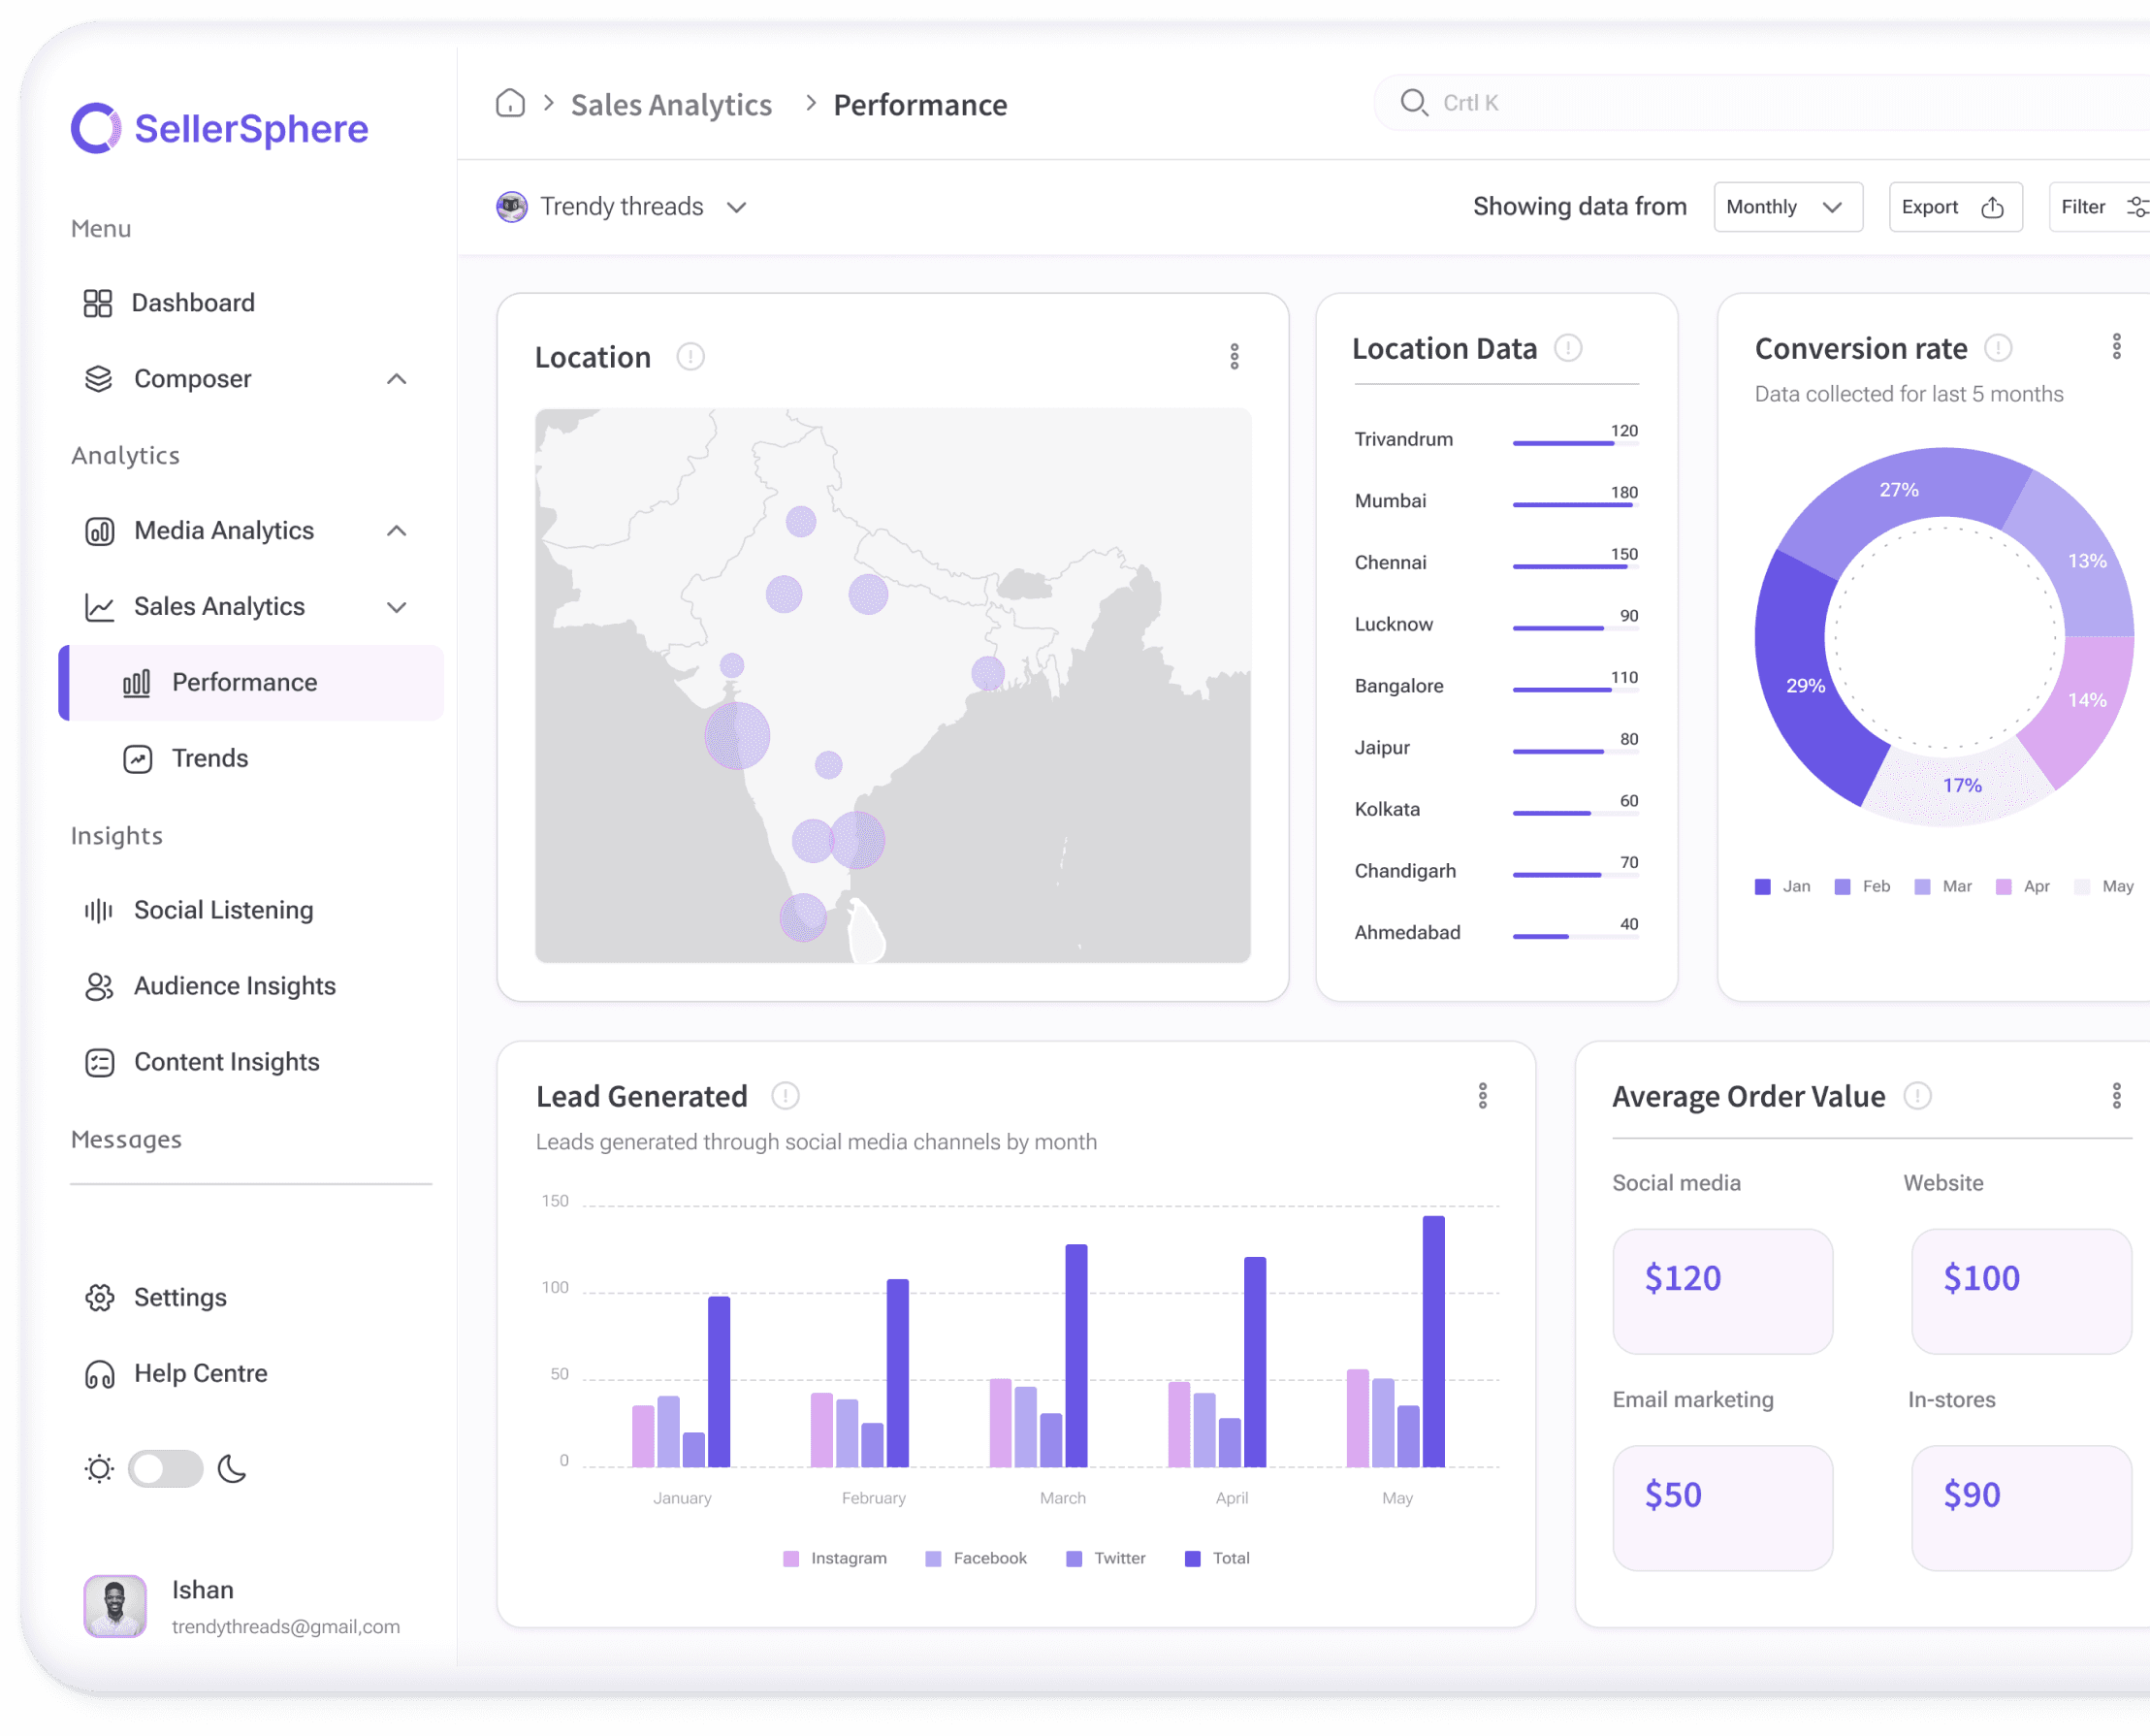

Discover actionable insights to refine your strategy.
Delve deeper into your audience, content performance, and competitive landscape. Uncover trends, identify opportunities, and make data-driven decisions.


Social Listening: Hear Your Audience
Monitor conversations around your brand, industry, and competitors. Identify emerging trends and customer sentiments.
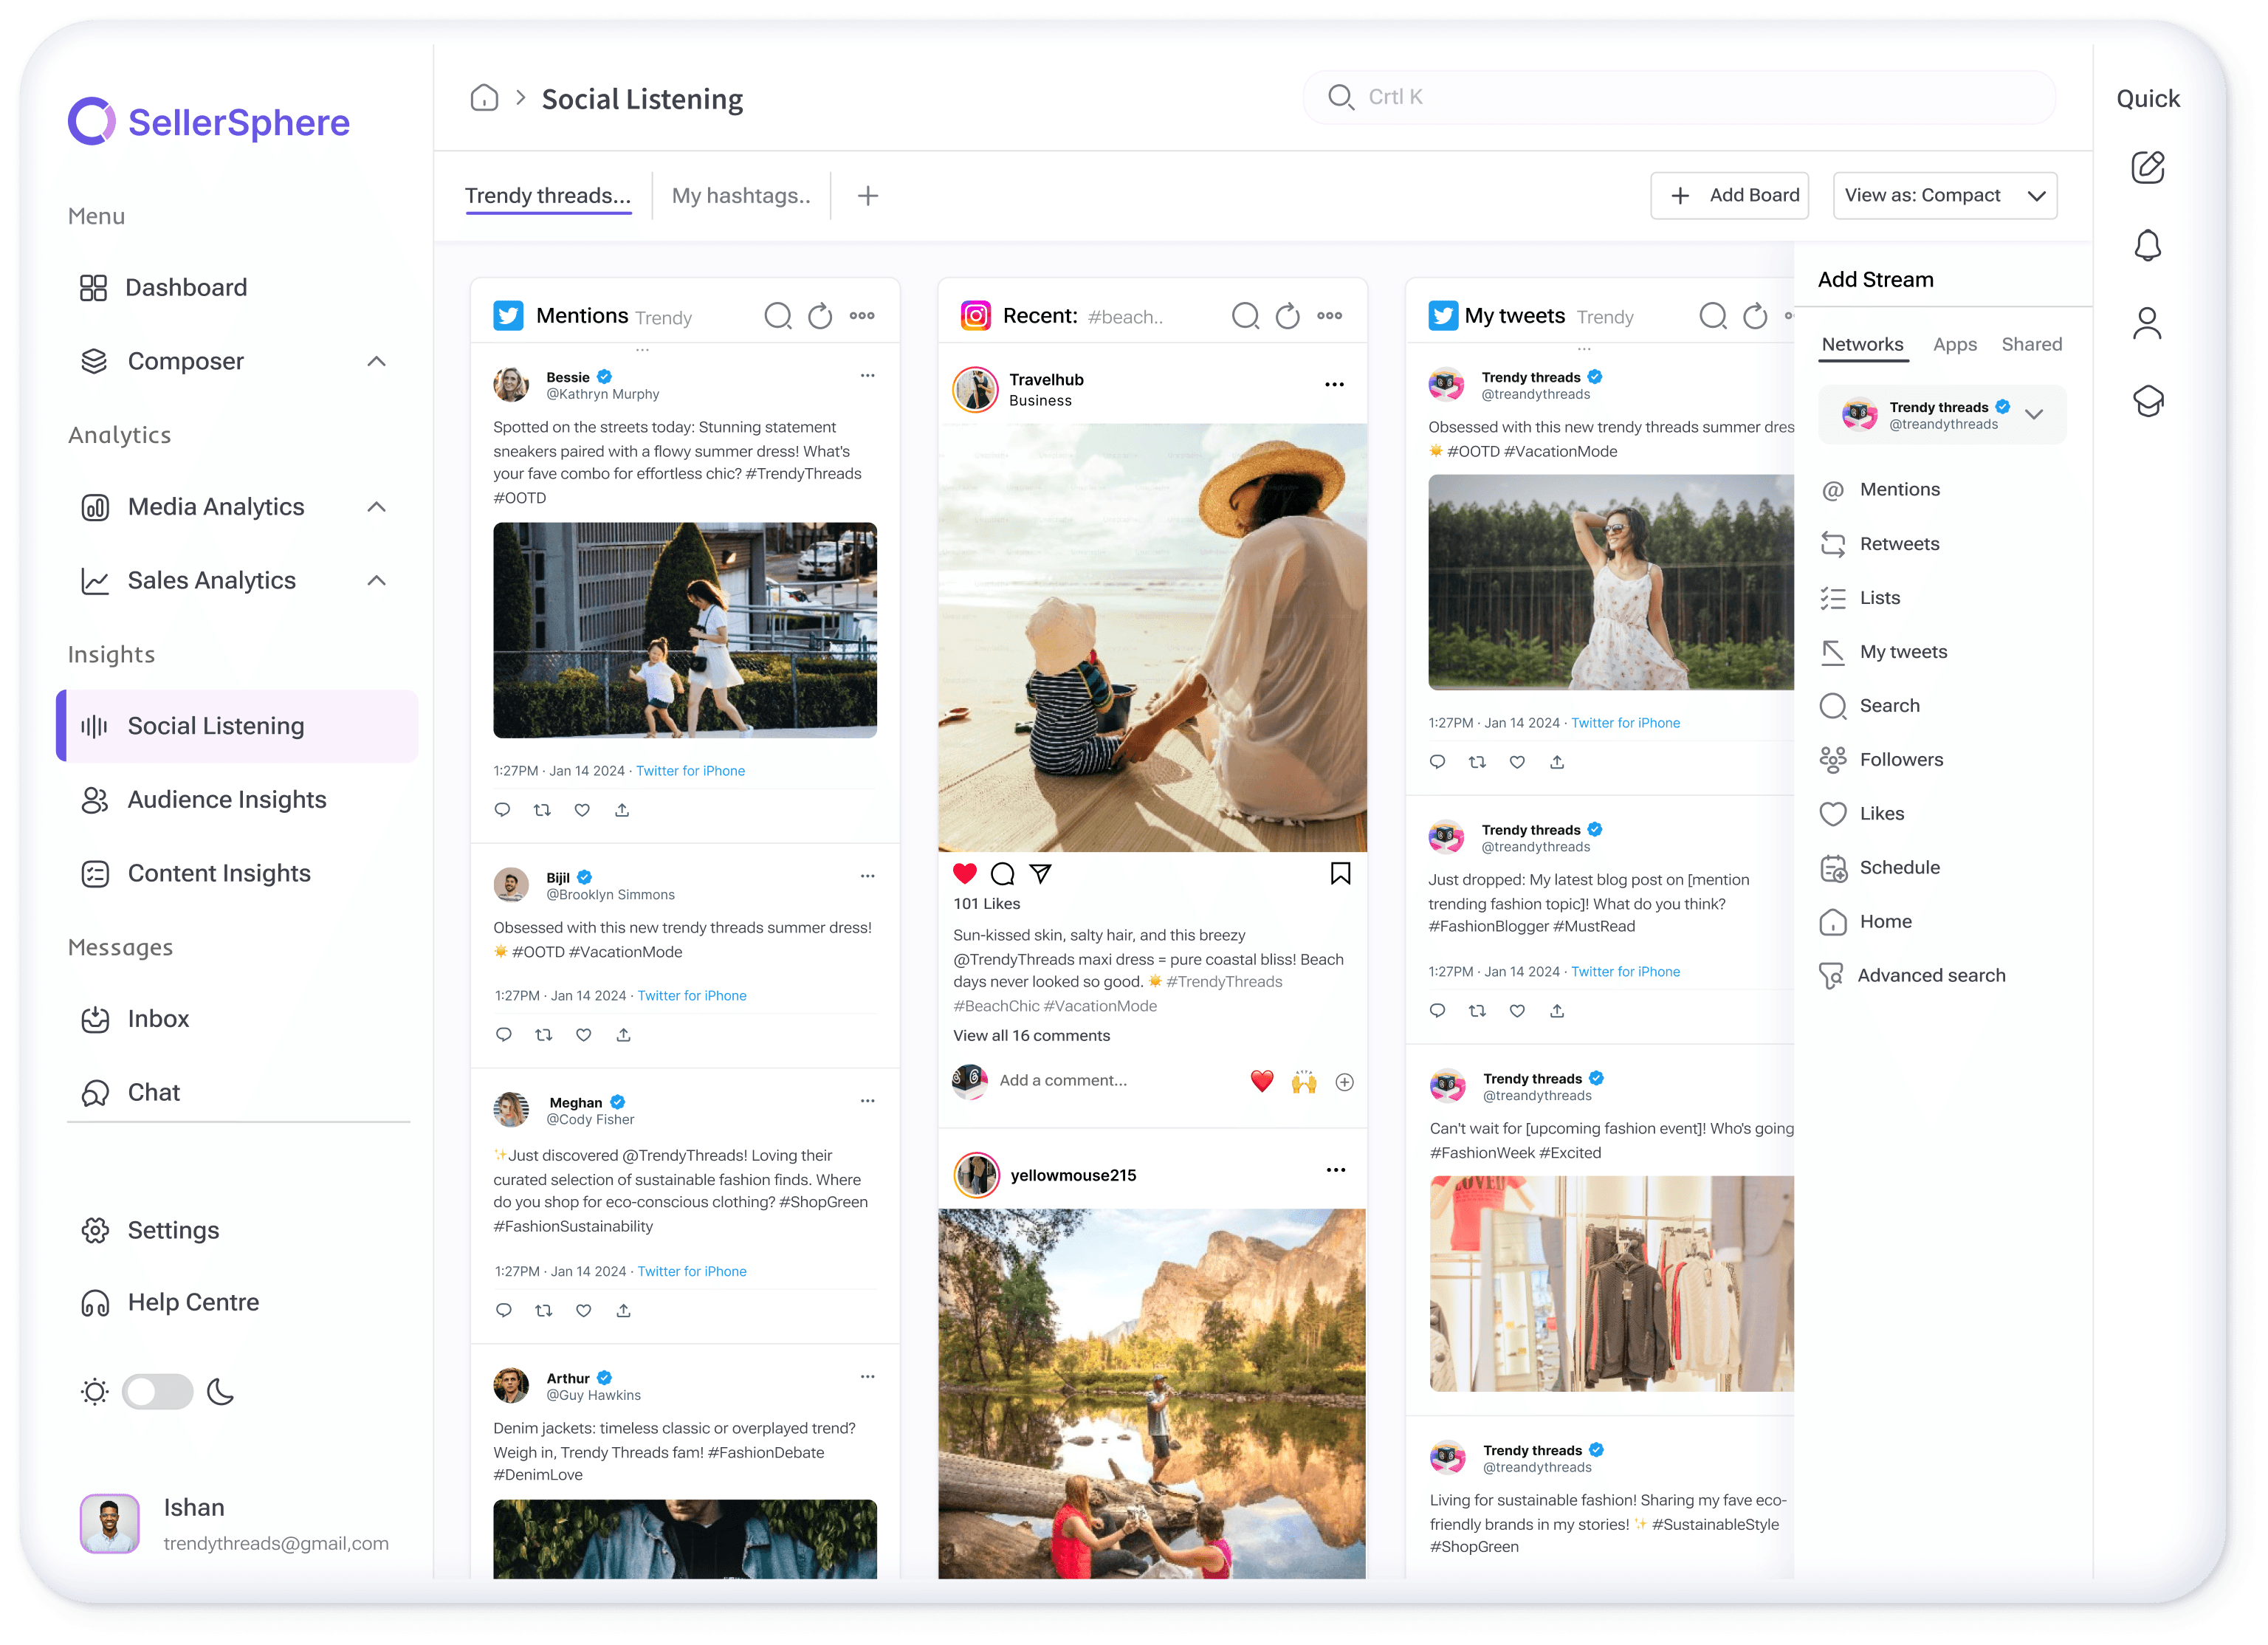
Real-time monitoring: Users demanded the ability to track mentions and conversations in real-time.
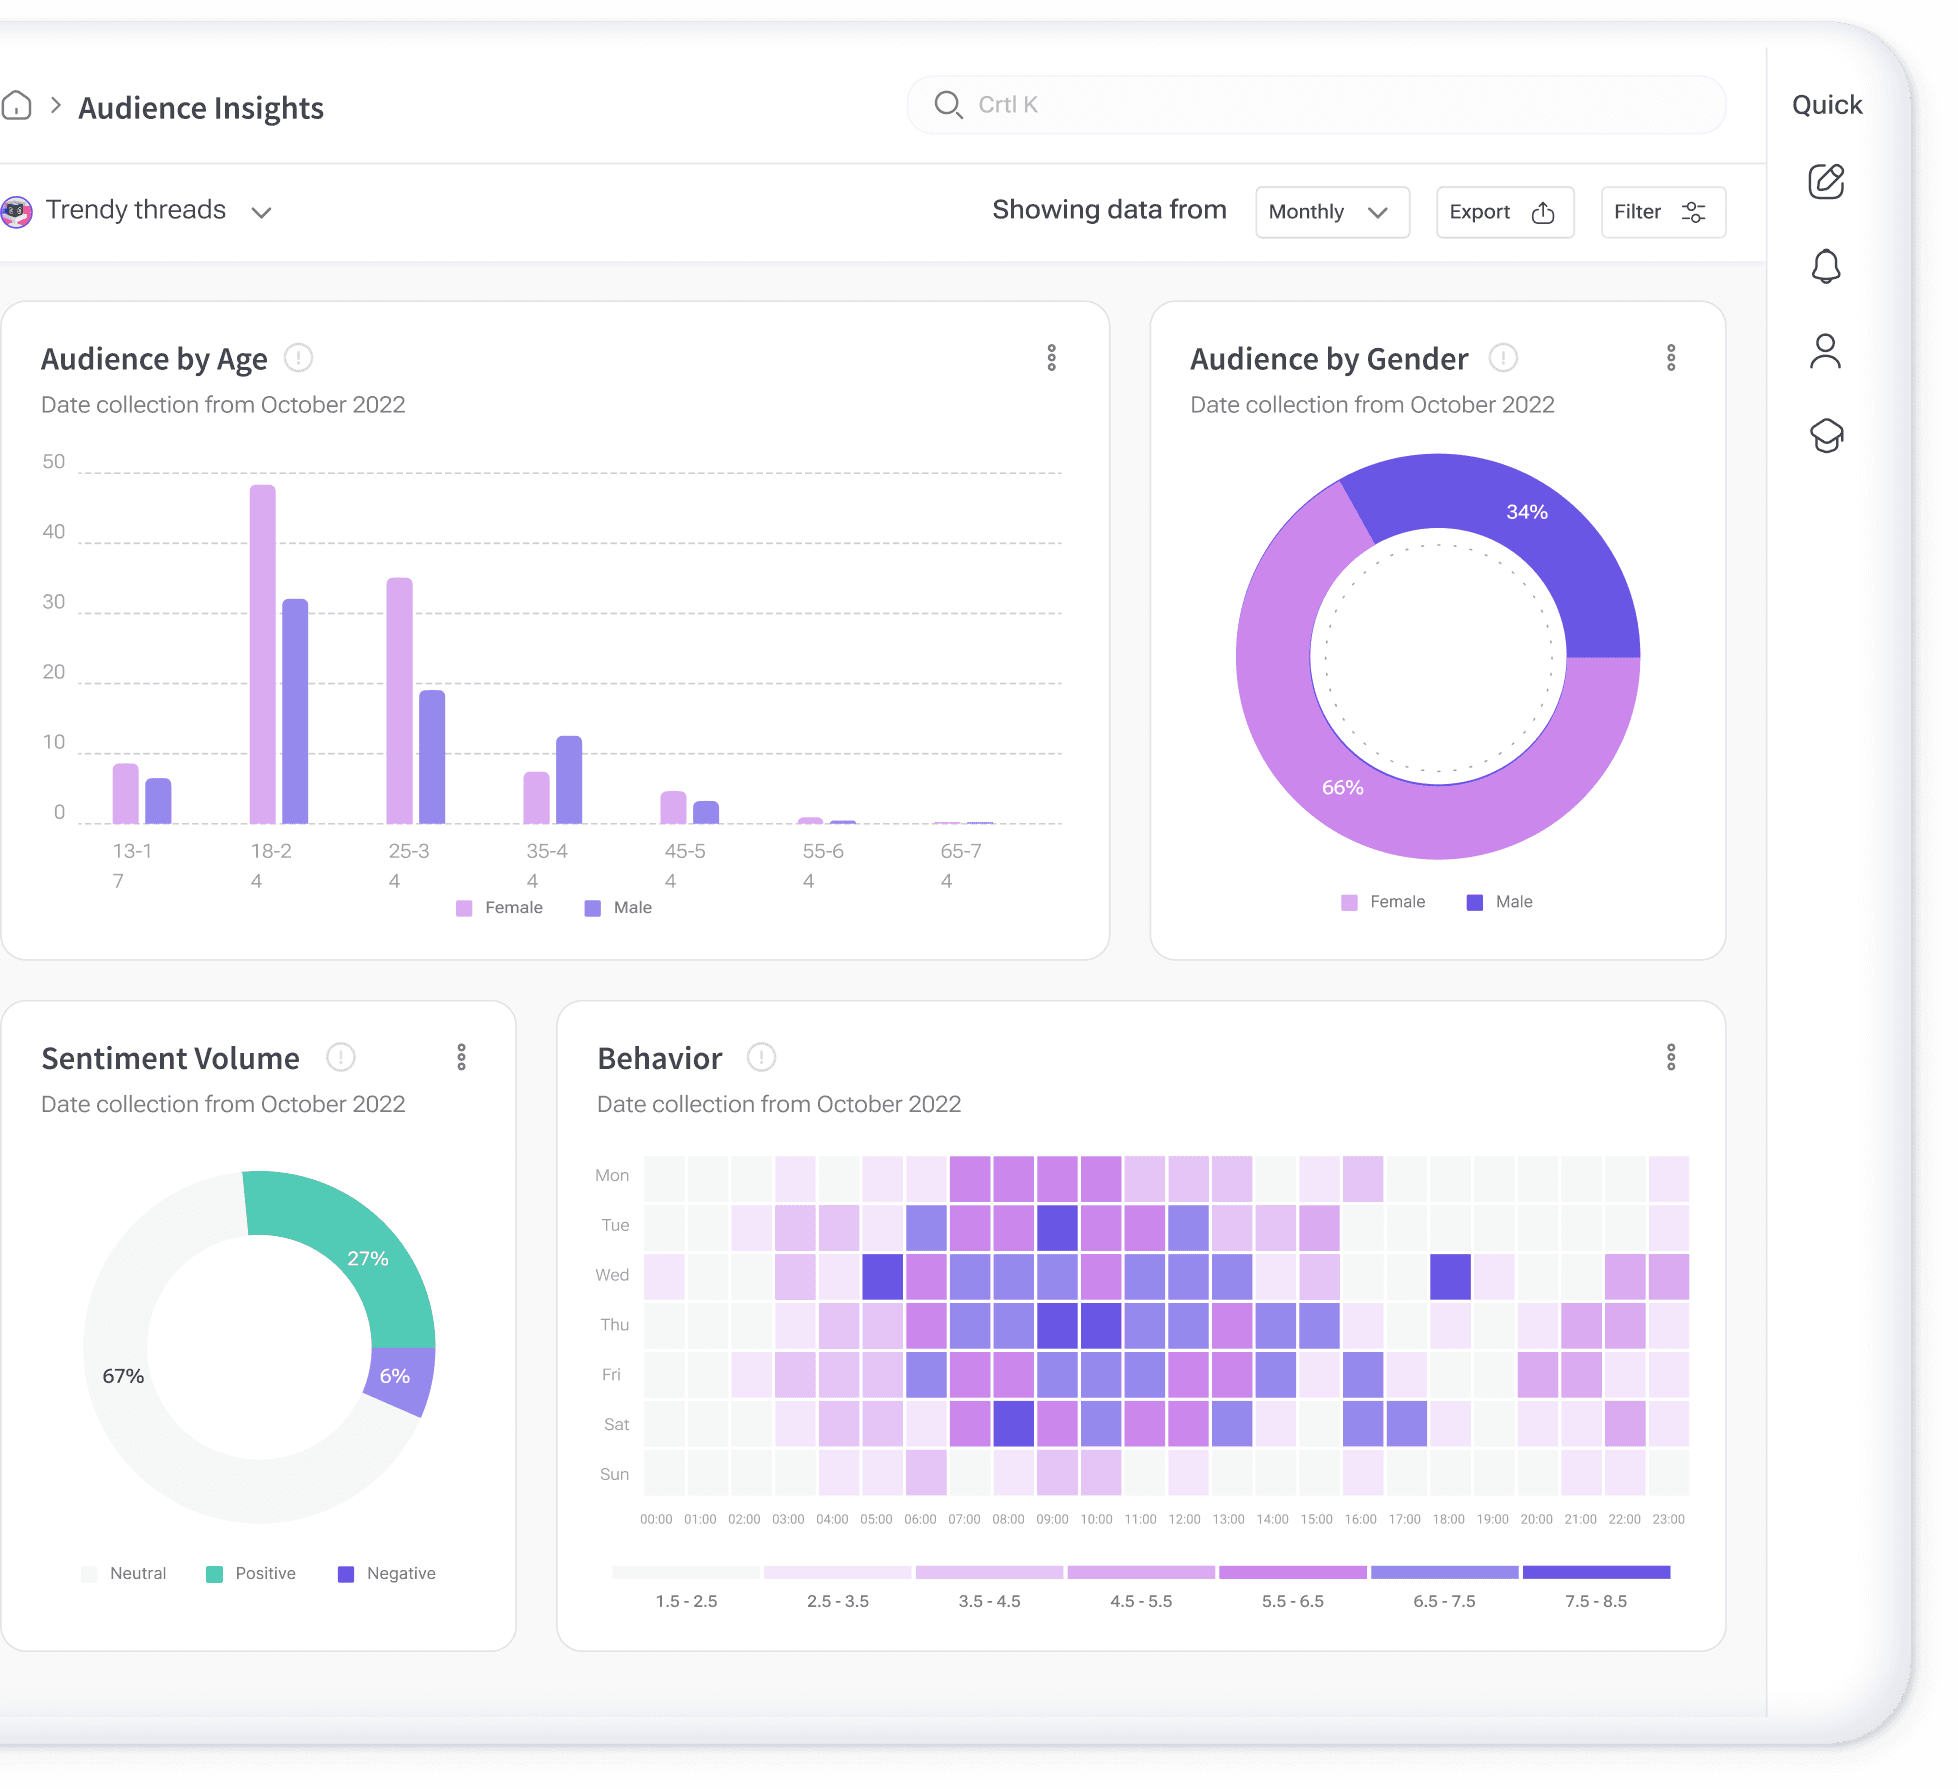
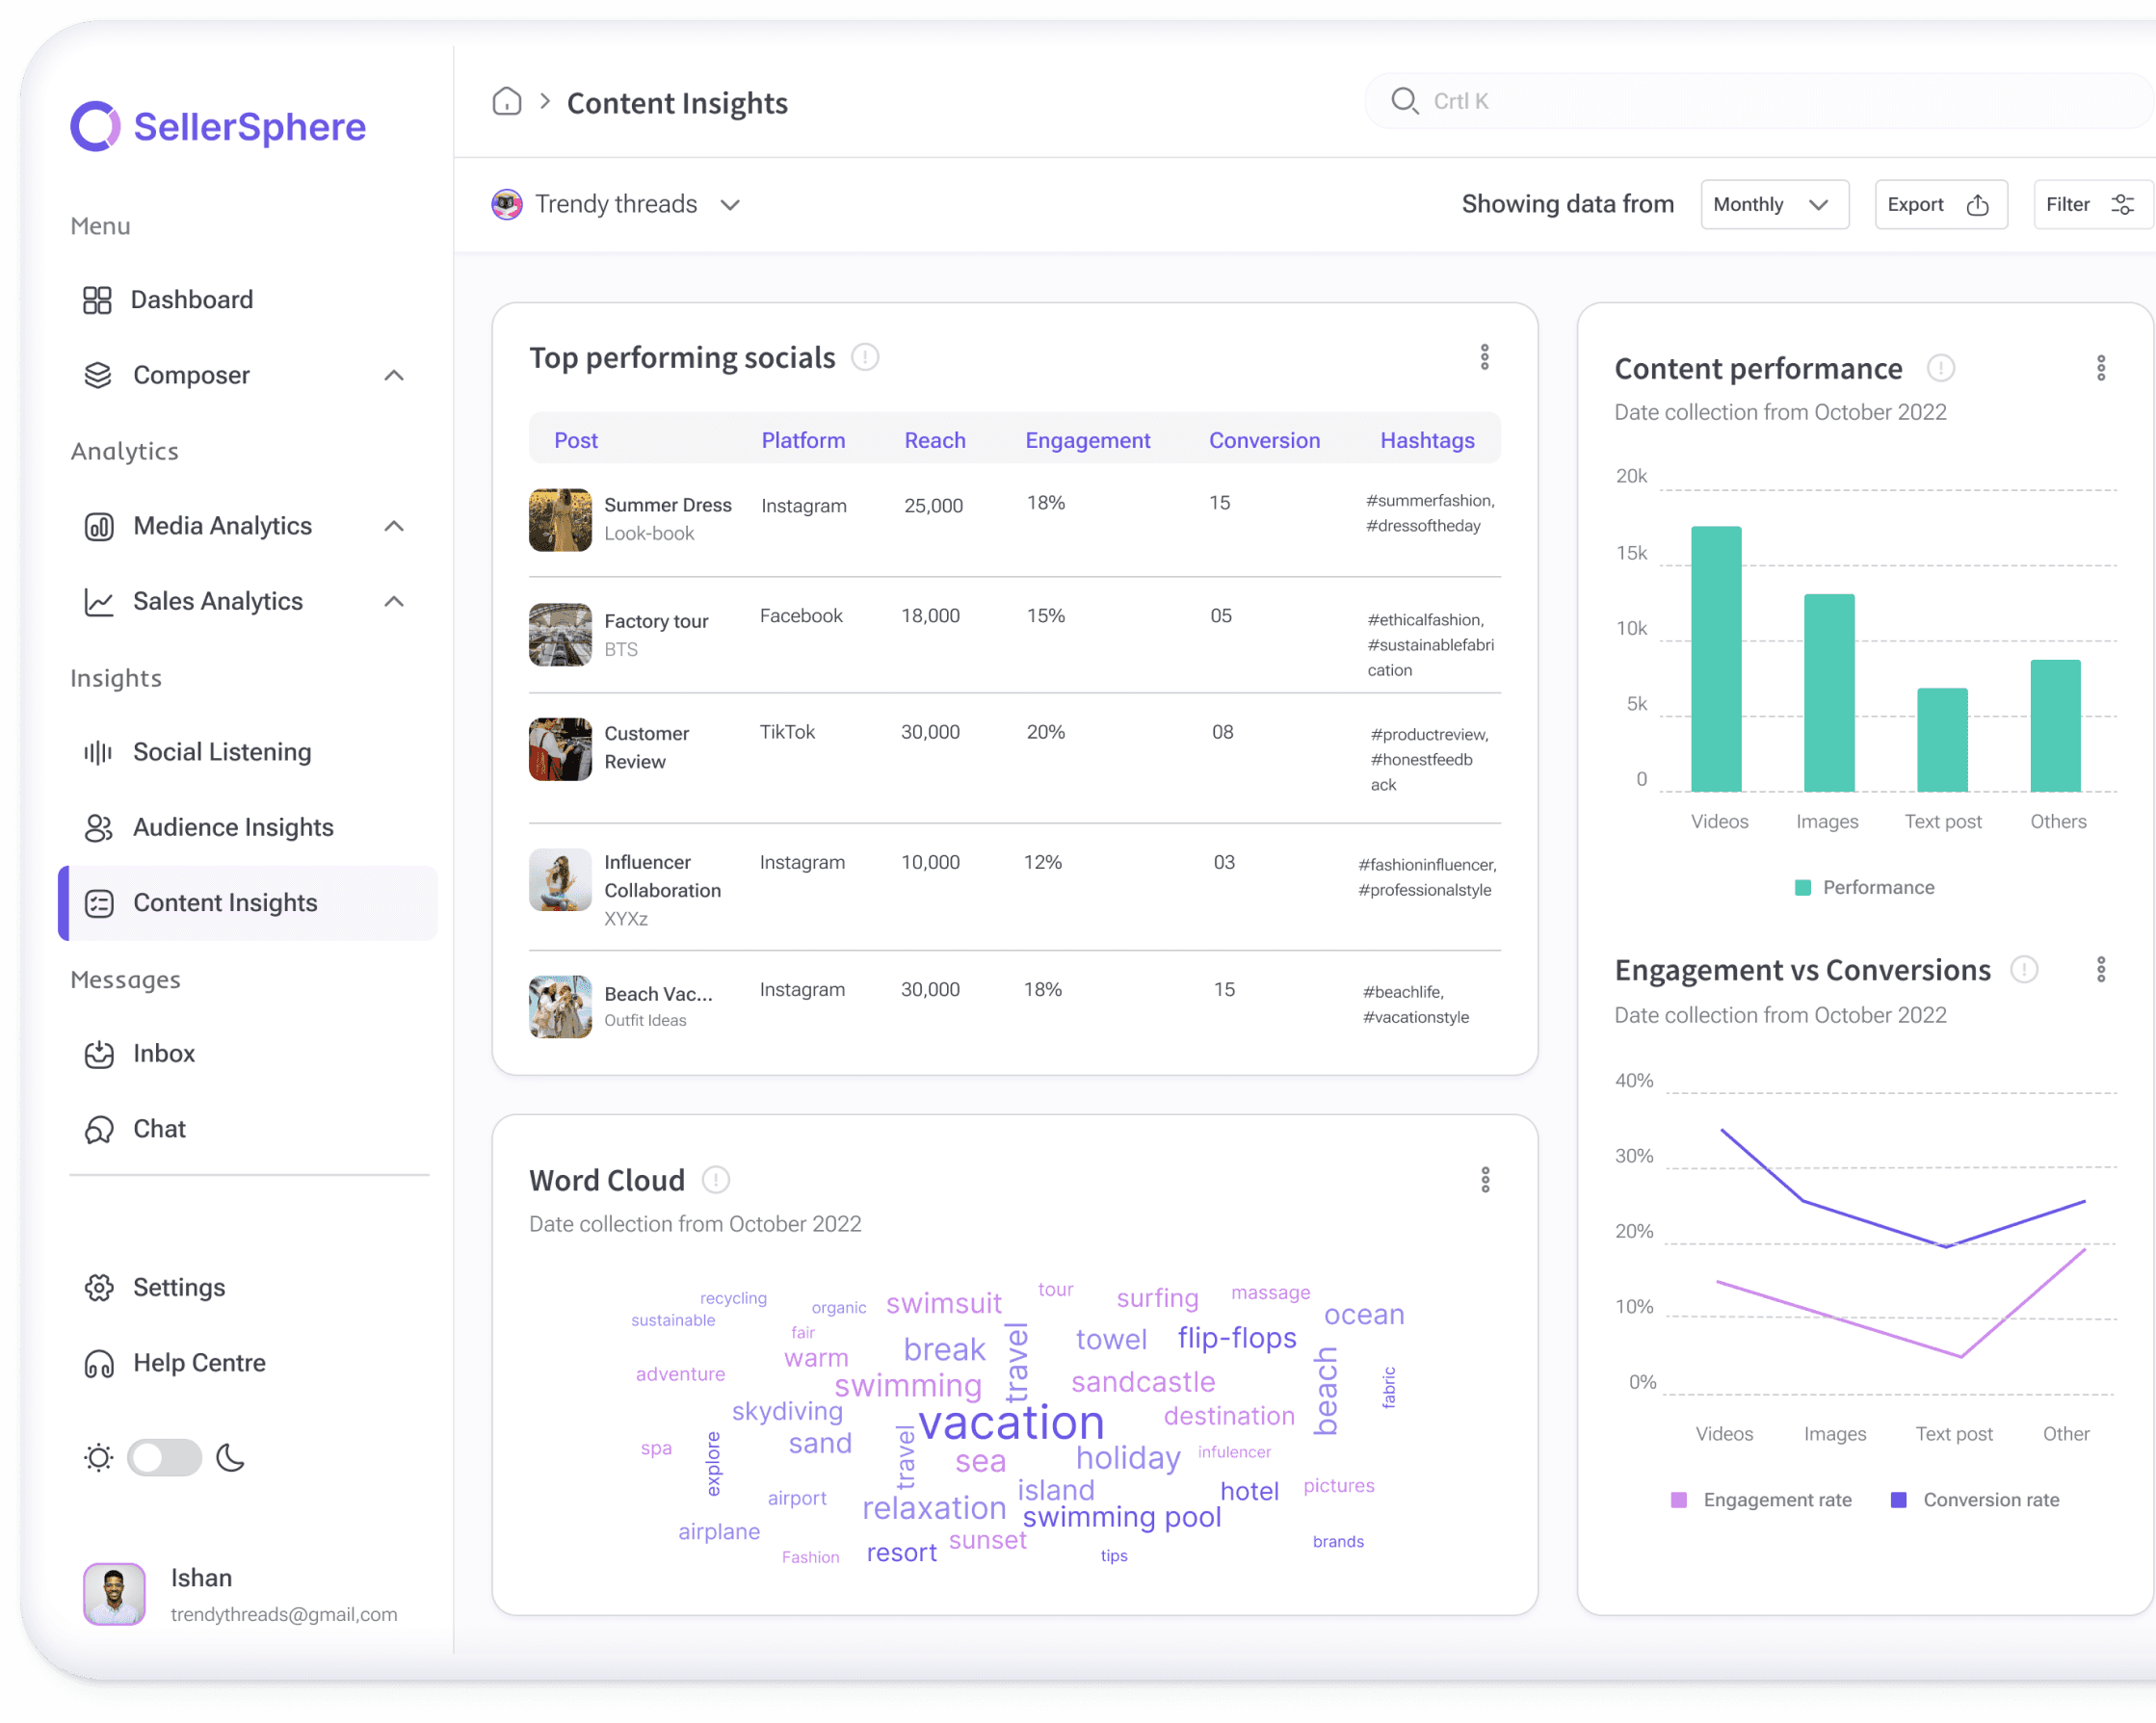
Understanding Your Audience and Content Performance
Gain deeper insights into your audience and content performance to optimize your social media strategy.Discover who your followers are, what they like, and how they engage with your brand. Analyze which types of content resonate best with your audience and identify trends.
Sentiment analysis: Gauge audience opinion and sentiment towards your brand, products, and campaigns.
User Behavior: Analyze audience interactions to understand peak engagement times, preferred content formats, and platform preferences.
Word Clouds: Discover frequently mentioned terms and themes within your social media data. Identify emerging trends and customer sentiments at a glance.
Boards: Organize your social listening efforts into focused areas for efficient monitoring.
Streams: Within each board, create specific streams to track mentions, keywords, and competitor activity.
Reflecting back
Through this project, I gained invaluable insights into the complexities of social media management and the critical role design plays in addressing user needs. While numerous aspects of the project contributed to its success, three key factors stand out:


User-Centric Design is Paramount
Understanding the target audience and their specific needs is crucial for creating a successful product. By focusing on user pain points and feedback, we were able to develop a platform that truly meets the needs of social sellers.
Data is the Cornerstone
The ability to collect, analyze, and visualize data is essential for providing value to users. SellerSphere's data-driven approach empowers users to make informed decisions and optimize their social media strategies.
Holistic Approach
By offering a suite of tools encompassing content creation, scheduling, analytics, and collaboration, SellerSphere empowers users to manage their entire social media strategy from a single platform. This holistic approach streamlines workflows, enhances efficiency.
Thank you ;)


